
Тechnical analysis of currency pairs (Anton Hanzenko)
EUR USD (current price: 1.2310)
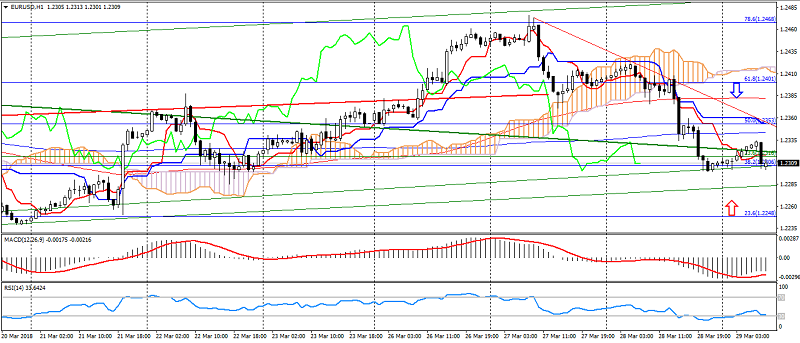
- Support levels: 1.2100 (September 2017 maximum), 1.1900, 1.1700.
- Resistance levels: 1.2600, 1.2750 (March 2013 minimum), 1.2270 (November 2014 minimum).
- Computer analysis: MACD (12,26,9) (signal – upward movement): the indicator is below 0, the signal line has left the body of the histogram. RSI (14) is in the oversold zone. IchimokuKinkoHyo (9,26,52) (signal-downward movement): the Tenkan-sen line is below the Kijun-sen line, the price is below the cloud.
- The main recommendation: sale entry is started from 1.2340, 1.2360, 1.2380.
- Alternative recommendation: buy entry is started from 1.2300, 1.2270, 1.2250.
The euro dollar remains in a downtrend, slowing down the decline on a technical correction.
GBP USD (current price: 1.4050)
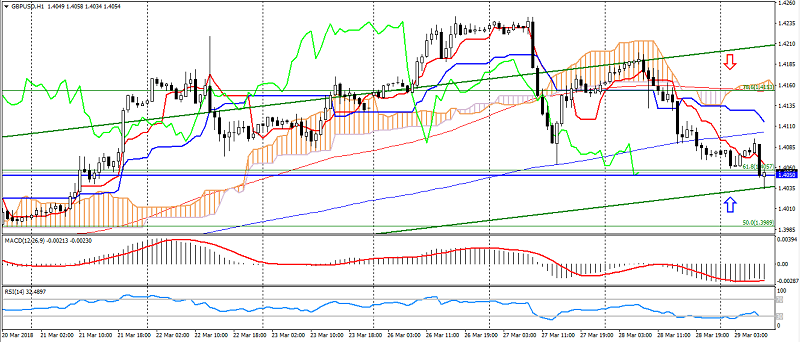
- Support levels: 1.3820,1.3650 (September 2017 maximum), 1.3450.
- Resistance levels: 1.4050, 1.4350, 1.4500.
- Computer analysis: MACD (12,26,9) (signal – upward movement): the indicator is below 0, the signal line has left the body of the histogram. RSI (14) is in the oversold zone. IchimokuKinkoHyo (9,26,52) (signal – downward movement): the Tenkan-sen line is below the Kijun-sen line, the price is below the cloud.
- The main recommendation: sale entry is started from 1.4080, 1.4120, 1.4150.
- Alternative recommendation: buy entry is started from 1.4030, 1.4000, 1.3980.
The British pound has significantly weakened on the recovery of the American, but maintains an upward trend, limited to support 1.4050-20.
USD CHF (current price: 0.9570)
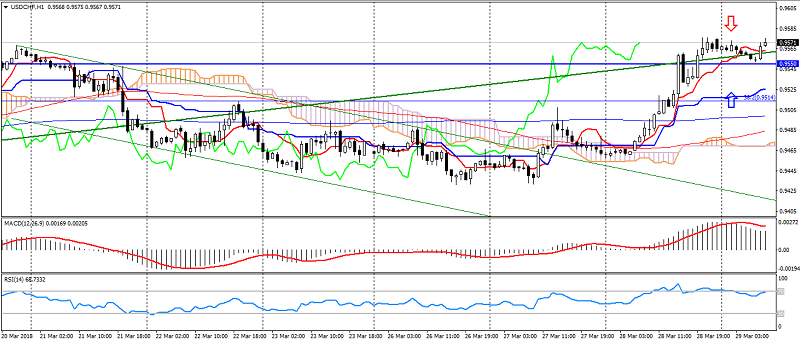
- Support levels: 0.9250 (August 2015 minimum), 0.9150, 0.9050 (May 2015 minimum).
- Resistance levels:, 0.9550, 0.9800, 1.0030 (November 2017 maximum).
- Computer analysis: MACD (12,26,9) (signal – downward movement): the indicator is higher than 0, the signal line has left the body of the histogram. RSI (14) is in the overbought zone. IchimokuKinkoHyo (9,26,52) (signal-going traffic): the Tenkan-sen line is above the Kijun-sen line, the price is higher than the cloud.
- The main recommendation: sale entry is started from 0.9580, 0.9600, 0.9620.
- Alternative recommendation: buy entry is started from 0.9550, 0.9520, 0.9500.
The Swiss franc was under pressure of the recovery of the US dollar, which caused the pair to return to an uptrend.
USD JPY (current price: 105.60)
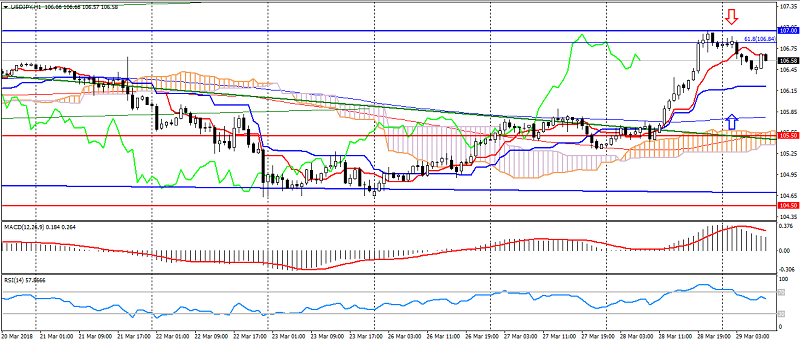
- Support levels: 105.50, 104.50, 103.40.
- Levels of resistance: 107.00, 108.00, 108.60.
- Computer analysis: MACD (12, 26, 9) (signal – downward movement): the indicator is above 0, the signal line has left the body of the histogram. RSI (14) is in the neutral zone. IchimokuKinkoHyo (9,26,52) (signal- downward movement): the Tenkan-sen line is above the Kijun-sen line, the price is higher than the cloud.
- The main recommendation: sale entry is started from 106.80, 107.00, 107.30.
- Alternative recommendation: buy entry is started from 106.30, 106.00, 105.80.
The Japanese yen remains under pressure of optimism, thereby breaking the uptrend, but limited to psychology at 107.00.
USD CAD (current price: 1.2920)
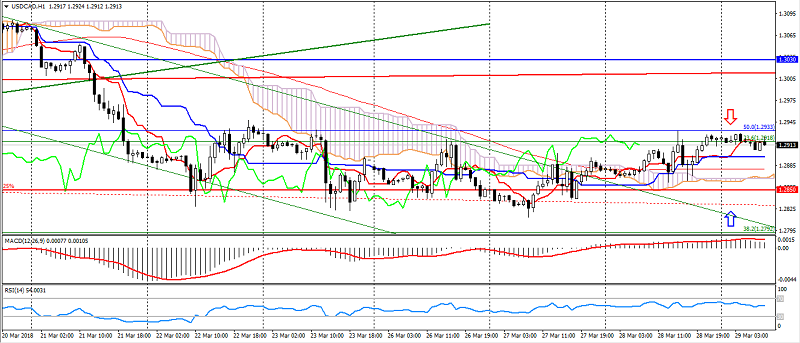
- Support levels: 1.2950, 1.2730.1.2600.
- Resistance levels: 1.3030, 1.3150, 1.3280.
- Computer analysis: MACD (12, 26, 9) (signal – downward movement): the indicator is above 0, the signal line has left the body of the histogram. RSI (14) is in the neutral zone. IchimokuKinkoHyo (9,26,52) (signal – upward movement): the Tenkan-sen line is above the Kijun-sen line, the price is higher than the cloud.
- The main recommendation: sale entry is started from 1.2940, 1.2960, 1.2980.
- Alternative recommendation: buy entry is started from 1.2890, 1.2850, 1.2830.
The USD/CAD pair remains in flat, falling within the range from 1.2830 to 1.2940.
AUD USD (current price: 0.7670)

- Support levels: 0.7900, 0.7700 (March 2017 maximum), 0.7500.
- Resistance levels: 0.8120 (2017 maximum), 0.8200, 0.8290 (2014 maximum).
- Computer analysis: MACD (12, 26, 9) (signal – upward movement): the indicator is below 0, the signal line has left the body of the histogram. RSI (14) is in the neutral zone. IchimokuKinkoHyo (9,26,52) (signal – downward movement): the Tenkan-sen line is below the Kijun-sen line, the price is below the cloud.
- The main recommendation: sale entry is started from 0.7700, 0.7720, 0.7740.
- Alternative recommendation: buy entry is started from 0.7640, 0.7620, 0.7600.
The Australian is traded with a decline, but is limited to oversold.
NZD USD (current price: 0.7200)
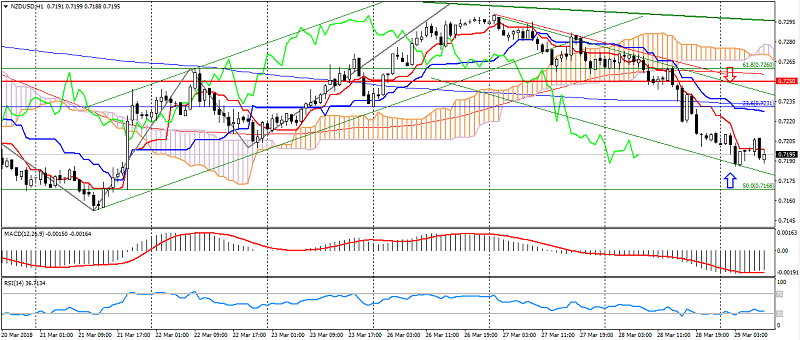
- Support levels: 0.7250, 0.7130 (August 2017 minimum), 0.7000.
- Resistance levels: 0.7380, 0.7450, 0.7550 (2017 maximum).
- Computer analysis: MACD (12, 26, 9) (signal- downward movement): the indicator is below 0, the signal line is in the body of the histogram. RSI (14) is in the oversold zone. IchimokuKinkoHyo (9,26,52) (signal – downward movement): the Tenkan-sen line is below the Kijun-sen line, the price is below the cloud.
- The main recommendation: sale entry is started from 0.7220, 0.7230, 0.7250.
- Alternative recommendation: buy entry is started from 0.7180, 0.7160, 0.7140.
The New Zealand dollar remains in a downward trend, limited to oversold.
XAU USD (current price: 1325.00)
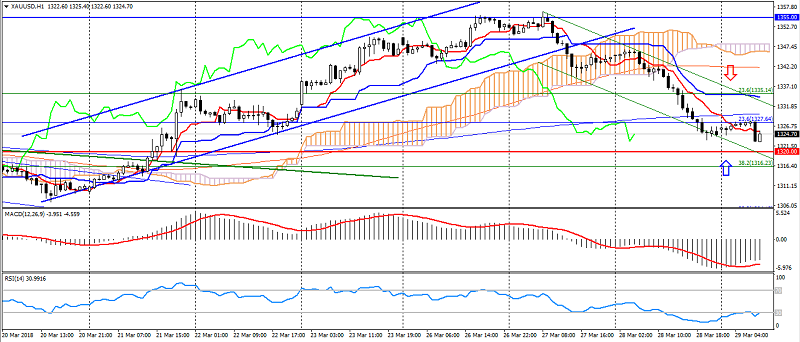
- Support levels: 1320.00, 1303.00, 1280.00.
- Resistance levels: 1355.00 (May May 2016 maximum), 1374.00, 1290.00 (March 2016 maximum).
- Computer analysis: MACD (12, 26, 9) (signal – upward movement): the indicator is below 0, the signal line has left the body of the histogram. RSI (14) is in the oversold zone. IchimokuKinkoHyo (9,26,52) (signal – downward movement): the Tenkan-sen line is below the Kijun-sen line, the price is below the cloud.
- The main recommendation: sale entry is started from 1331.00, 1335.00, 1342.00.
- Alternative recommendation: buy entry is started from 1320.00, 1316.00, 1313.00.
Gold keeps a downward trend, limited to oversold.