
Technical Analysis of Oil (Alexander Sivtsov)
Oil is traded near zero marks during the Asian session.
The Brent graph (current price: $ 6389.20 per 100 barrels)
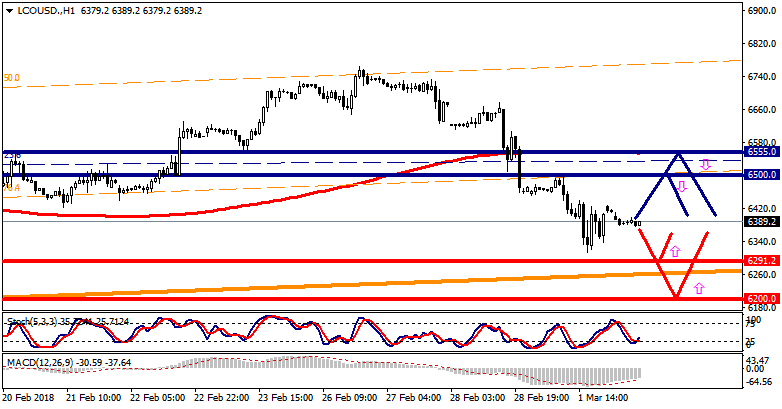
The Brent brand is traded near the zero mark during the Asian session.
- Resistance 1: From $ 6500.00 (psychological level)
- Resistance 2: From $ 6555.00 (MA 200 on H1)
- Support 1: From $ 6291.20 (February 15 minimum)
- Support 2: From $ 6200.00 (psychological level)
Computer analysis: The Stochastic Oscillator movings on the H4 chart are in the neutral zone. The consolidation of the Brent price is possible.
The WTI graph (current price: $ 6087.70 per 100 barrels)
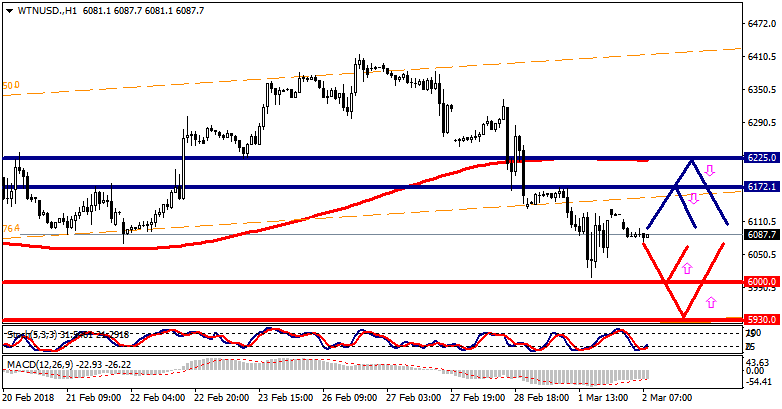
The WTI brand is traded with a small minus during the Asian session.
- Resistance 1: From $ 6172.10 (March 1 maximum)
- Resistance 2: From $ 6225.00 (MA 200 on H1)
- Support 1: From $ 6000.00 (psychological level)
- Support 2: With $ 5930.00 (Support line of the Up Channel on H4)
Computer analysis: The Stochastic Oscillator movings on the H4 chart are in the neutral zone, one should expect the WTI price movement in a narrow range.