
Technical Analysis of Oil (Alexander Sivtsov)
Oil shows negative dynamics during the Asian session.
Brent chart (current price: $ 67.80)
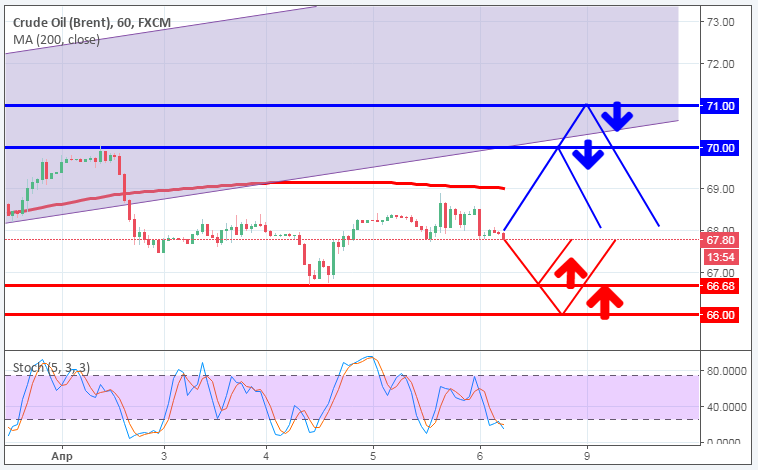
The Brent is traded below the zero mark during the Asian session.
- Resistance 1: From $ 70.00 (psychological level)
- Resistance 2: From $ 71.00 (psychological level)
- Support 1: From $ 66.68 (April 4 minimum)
- Support 2: From $ 66.00 (psychological level)
Computer analysis: The Stochastic Oscillator movings on the H4 chart enter the oversold zone. So, the Brent price may recover.
WTI chart (current price: $ 63.00)
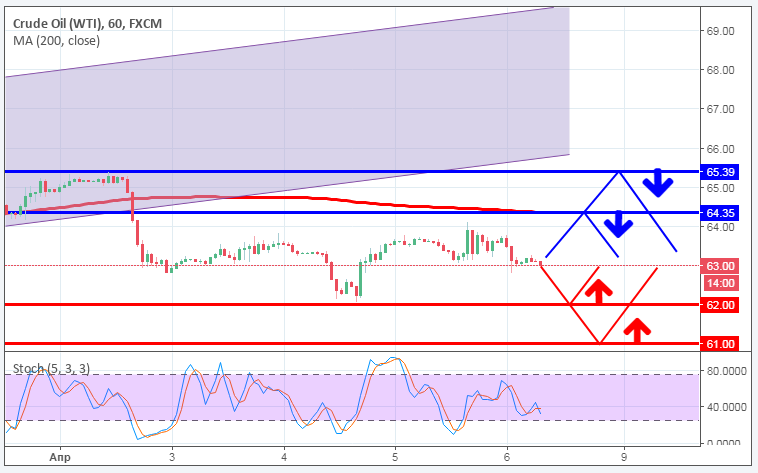
The WTI brand is traded with a minus during the Asian session.
- Resistance 1: From $ 64.35 (MA 200 on H1)
- Resistance 2: From $ 65.39 (April 2 maximum)
- Support 1: From $ 62.00 (psychological level)
- Support 2: From $ 61.00 (psychological level)
Computer analysis: The Stochastic Oscillator movings on the H4 chart are included in the oversold zone, in connection with which it is necessary to expect the growth of the WTI price in the second half of trading on Friday.