
Technical Analysis of Oil (Alexander Sivtsov)
Oil is traded below the zero mark in the Asian session.
Brent graph (current price: $ 69.57)
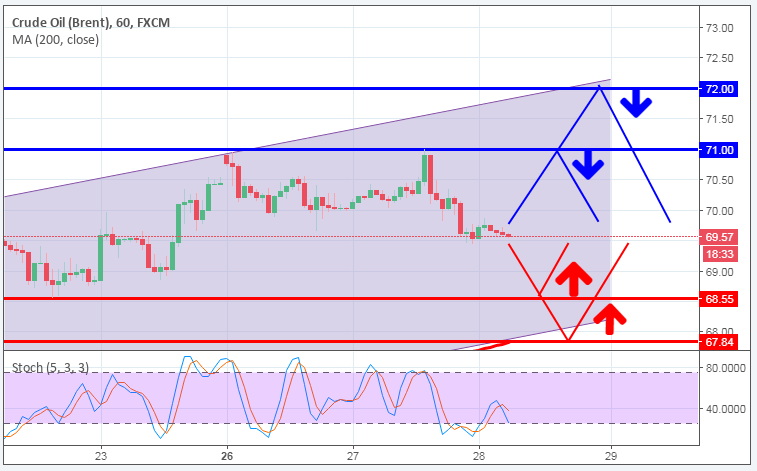
The Brent is traded below the zero mark during the Asian session.
- Resistance 1: From $ 71.00 (psychological level)
- Resistance 2: From $ 72.00 (psychological level)
- Support 1: From $ 68.55 (March 22 minimum)
- Support 2: From $ 67.84 (MA 200 on H1)
Computer analysis: The Stochastic Oscillator movings on the chart H1 are included in the oversold zone, against which the Brent price may recover.
WTI graph (current price: $ 64.61)
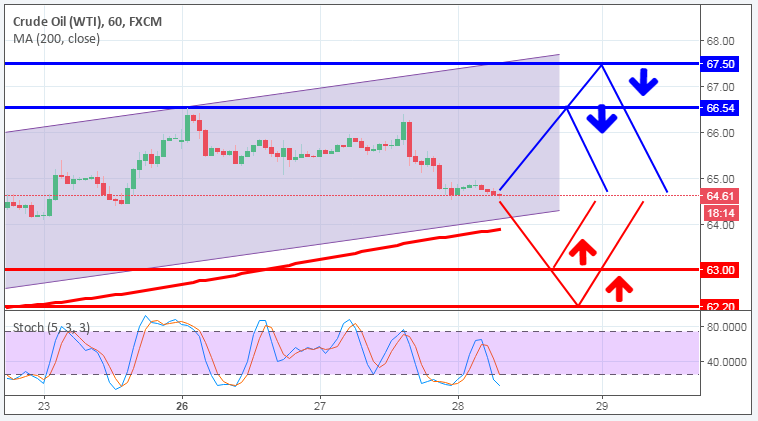
The WTI brand is traded with a minus during the Asian session.
- Resistance 1: From $ 66.54 (March 26 maximum)
- Resistance 2: From $ 67.50 (technical level)
- Support 1: From $ 63.00 (psychological level)
- Support 2: From $ 62.20 (technical level)
Computer analysis: The Stochastic Oscillator movings on the H1 chart are in the oversold zone, in connection with which one should expect a certain increase in the price of WTI.
Alexander Sivtsov