
Technical Analysis of Oil (Alexander Sivtsov)
Oil is traded above the zero mark in the Asian session.
The Brent graph (current price: $ 69.53)
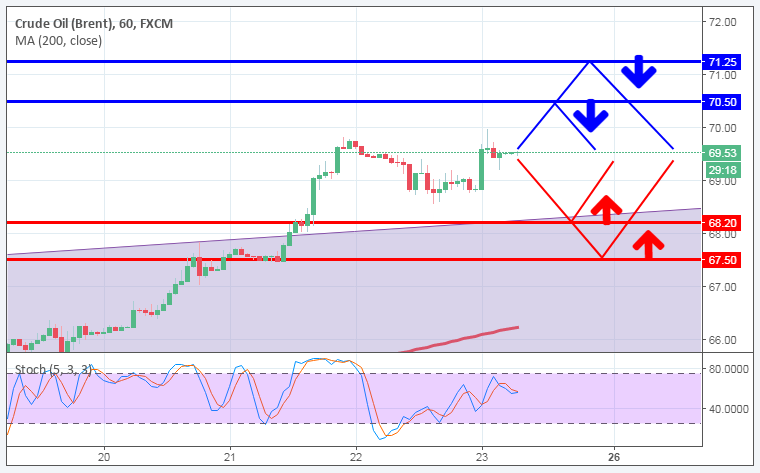
The Brent brand is traded above the zero mark during the Asian session.
- Resistance 1: From $ 70.50 (technical level)
- Resistance 2: From $ 71.25 (2018 maximum)
- Support 1: From $ 68.20 (broken line of resistance of Up channel on H1)
- Support 2: From $ 67.50 (technical level)
Computer analysis: The Stochastic Oscillator movings on the chart of H1 are in the neutral zone, against which the formation of consolidation of the Brent price is possible.
The WTI graph (current price: $ 65.04)
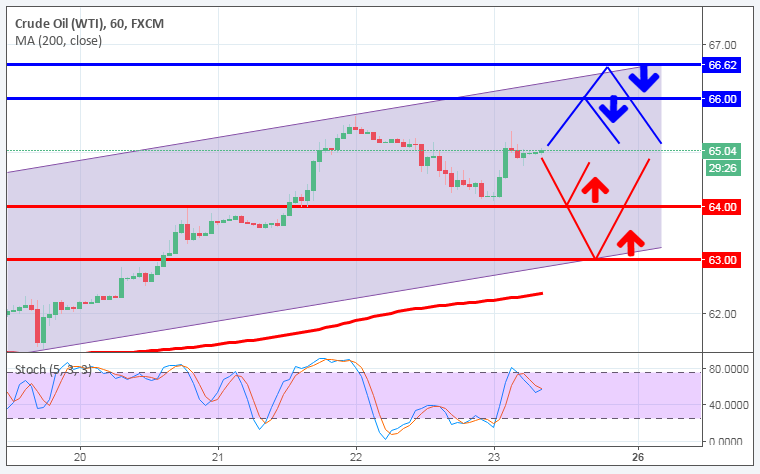
The WTI brand is traded with a plus during the Asian session.
- Resistance 1: From $ 66.00 (psychological level)
- Resistance 2: From $ 66.62 (2018 maximum)
- Support 1: From $ 64.00 (psychological level)
- Support 2: From $ 63.00 (psychological level)
Computer analysis: The Stochastic Oscillator movings on the chart H1 are in the neutral zone, in connection with which the movement of the price of WTI in a narrow range is expected.