
Technical Analysis of Oil (Alexander Sivtsov)
Oil is traded near zero marks during the Asian session.
Brent graph (current price: $ 69.33)
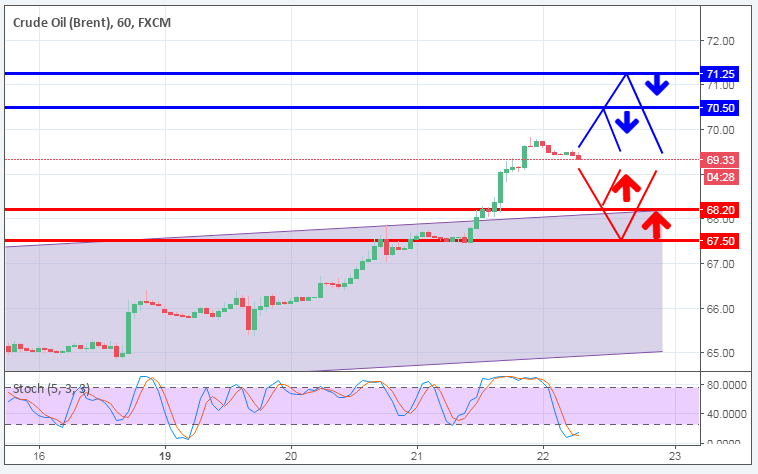
The Brent brand is traded near the zero mark during the Asian session.
- Resistance 1: From $ 70.50 (technical level)
- Resistance 2: From $ 71.25 (2018 maximum)
- Support 1: From $ 68.20 (broken resistanc line of Up channel on H1)
- Support 2: From $ 67.50 (technical level)
Computer analysis: The Stochastic Oscillator movings on the H1 chart indicate the oversold of the instrument, against which the continuation of the growth of the Brent price in the second half of the trades is possible.
WTI graph (current price: $ 63.67)
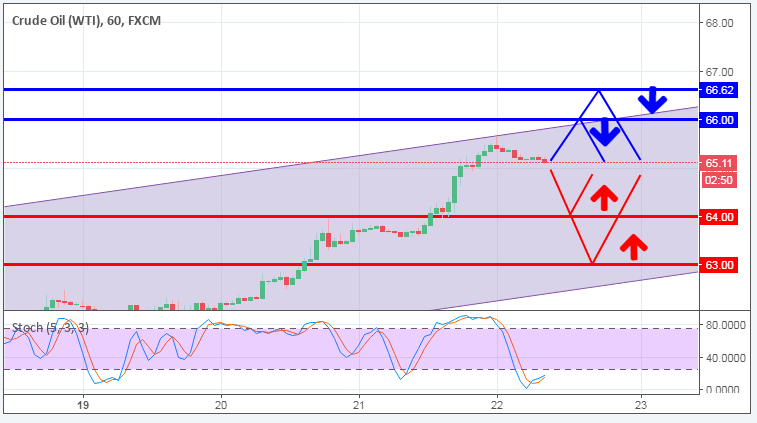
The WTI brand is traded in a narrow range during the Asian session.
- Resistance 1: From $ 66.00 (psychological level)
- Resistance 2: From $ 66.62 (2018 maximum)
- Support 1: From $ 64.00 (psychological level)
- Support 2: From $ 63.00 (psychological level)
Computer analysis: The Stochastic Oscillator movings on the H1 chart indicate the oversold of the instrument, in connection with which it is necessary to expect the resumption of the growth of the WTI price in the second half of the trades.