
Technical Analysis of Oil (Alexander Sivtsov)
Oil shows mixed dynamics during the Asian session.
The Brent Graph (current price: $ 64.86)

Brand Brent is trading just below the zero mark during the Asian session.
- Resistance 1: From $ 65.84 (March 12 maximum)
- Resistance 2: From $ 67.00 (psychological level)
- Support 1: From $ 63.43 (March 8 minimum)
- Support 2: From $ 62.80 (technical level)
Computer analysis: The movings of the Stochastic Oscillator forex indicator on the H1 graph are in the neutral zone, against which the Brent price may move in a narrow range in anticipation of data on oil reserves in the US.
The WTI Graph (current price: $ 61.22)
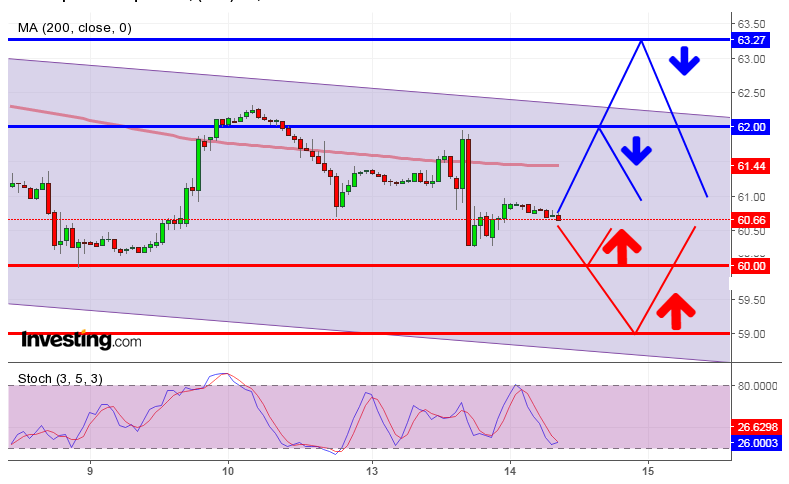
Brand WTI trades with a small plus during the Asian session.
- Resistance 1: From $ 62.00 (psychological level)
- Resistance 2: From $ 63.27 (March 6 maximum)
- Support 1: From $ 60.00 (psychological level)
- Support 2: From $ 59.00 (psychological level)
Computer analysis: The movings of the Stochastic Oscillator forex indicator on the H1 graph are in the neutral zone, so we should expect the consolidation of the WTI price.