Technical Analysis of Oil (Alexander Sivtsov)
Oil is traded near zero marks during the Asian session.
The Brent graph (current price: $ 6470.90 per 100 barrels)
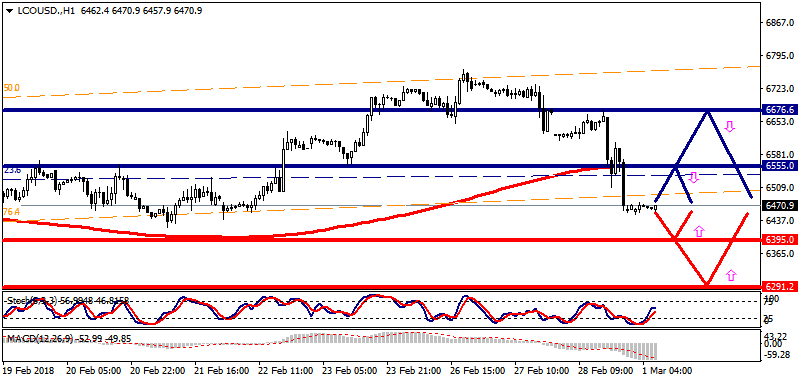
The Brent brand is traded near the zero mark during the Asian session.
- Resistance 1: From $ 6555.00 (MA 200 on H1)
- Resistance 2: From $ 6676.60 (February 28 maximum)
- Support 1: From $ 6395.00 (technical level)
- Support 2: From $ 6291.20 (February 15 minimum)
Computer analysis: The Stochastic Oscillator movings on the H4 chart indicate the oversold of the instrument, so the Brent price may recover.
The WTI graph (current price: $ 6159.70 per 100 barrels)
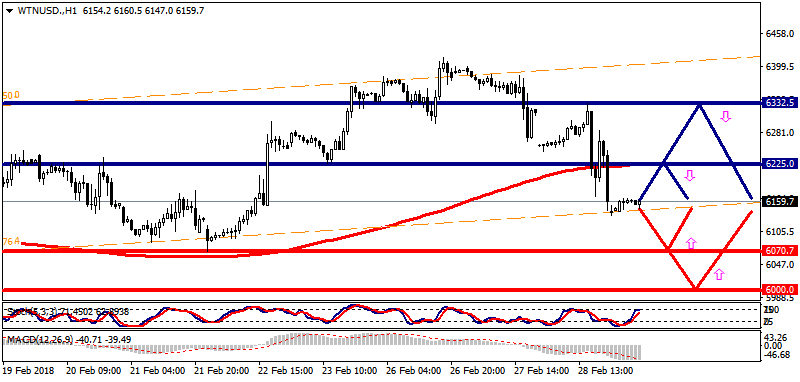
The WTI brand has a slight advantage during the Asian session.
- Resistance 1: From $ 6225.00 (MA 200 on H1)
- Resistance 2: From $ 6332.50 (February 28 maximum)
- Support 1: From $ 6,070.70 (February 22 minimum)
- Support 2: From $ 6000.00 (psychological level)
Computer analysis: The Stochastic Oscillator movings on the H4 chart indicate the oversold of the instrument, the recovery of the WTI price is expected.