
Technical Analysis of Oil (Alexander Sivtsov)
Oil is traded below the zero mark in the Asian session.
The Brent graph (current price: $ 6459.10 per 100 barrels)
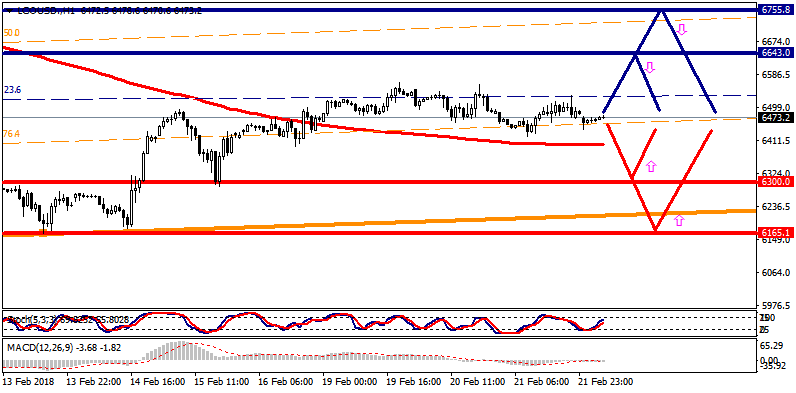
The Brent is traded with a minus during the Asian session.
- Resistance 1: From $ 6643.00 (February 6 minimum)
- Resistance 2: From $ 6755.80 (February 7 maximum)
- Support 1: From $ 6300.00 (psychological level)
- Support 2: From $ 6165.10 (February 13 minimum)
Computer analysis: The Stochastic Oscillator movings on the charts of H1 and H4 are in the neutral zone, so the formation of the consolidation of the price of Brent is possible.
The WTI graph (current price: $ 6113.10 per 100 barrels)
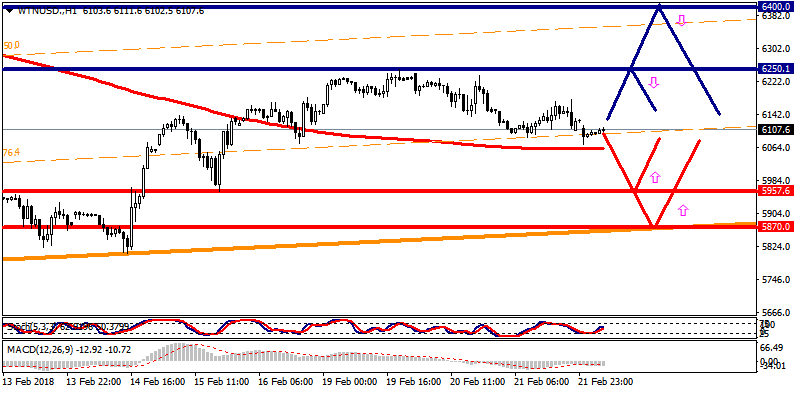
The WTI brand is traded below the zero mark during the Asian session.
- Resistance 1: From $ 6250.10 (February 19 maximum)
- Resistance 2: From $ 6400.00 (psychological level)
- Support 1: From $ 5957.60 (February 15 minimum)
- Support 2: With $ 5870.00 (Support Up Channel on H4)
Computer analysis: The Stochastic Oscillator movings on the charts of H1 and H4 are in the neutral zone, so the consolidation of the price of WTI, in anticipation of data on oil reserves in the US is possible.