
Technical analysis of gold and silver (Alexander Sivtsov)
Gold chart (current price: $ 1344.70)
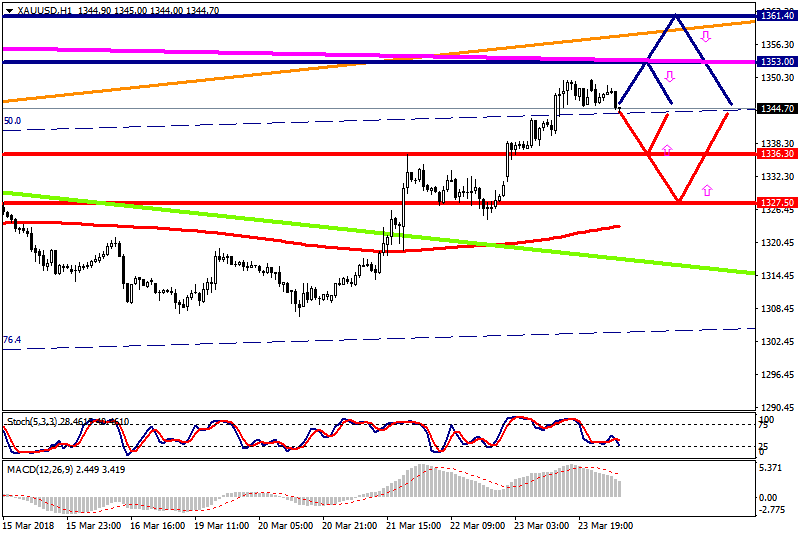
Gold is trading below the zero mark during the Asian session.
- Resistance 1: From $ 1353.00 (line of resistance of the Low channel to W1)
- Resistance 2: From $ 1361.40 (February 16 high)
- Support 1: From $ 1336.30 (March 21 maximum)
- Support 2: From $ 1327.50 (technical level)
Computer analysis: Moving indicators of the Stochastic Oscilliator forex indicator on the H4 chart indicate overbought instruments, against which one should expect a decline in the price of gold.
Silver chart (current price: $ 16.50)

Silver is traded with a minus during the Asian session.
- Resistance 1: From $ 16.64 (technical level)
- Resistance 2: From $ 16.82 (March 6 maximum)
- Support 1: From $ 16.31 (technical level)
- Support 2: From $ 16.07 (March 20 minimum)
Computer analysis: For silver, moving indicators of the Stochastic Oscilliator forex indicator on the H4 chart are in the neutral zone, against which a consolidation of the price of silver is possible.