
Candlestick analysis. The main candlestick patterns. Part 1. Alexander Sivtsov.
Today we will discuss not a simple topic – candlestick patterns on the chart, namely, reversal patterns. The reversal patterns are observed on the market during the formation of particular types of candlesticks, and they are called reversal because when certain candlesticks are formed on the chart, the chance of a change in the trend movement in the opposite direction increases.
Candlestick patterns. Part 1.
Today we will consider 2 types of candlesticks: Doji and SpinningTop.
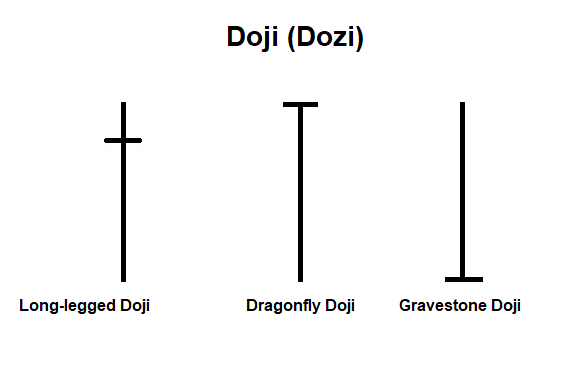
Doji (dozi) is a type of candlestick that has no body, in other words the opening price and the closing price are equal. When considering a formed doji on the chart, special attention should be paid to its shadow; the longer the doji’s shadow, the stronger its pattern. With sideways, a doji means that the market is in equilibrium, as bulls and bears have the same effect on the market.
Doji by themselves do not carry enough information to analyze the future price movement in the market; therefore, they consider such a concept as candlestick patterns, and not a reversal candlestick. When the Doji is creating on the chaty, it is worth considering which candlesticks were formed on the chart before it.
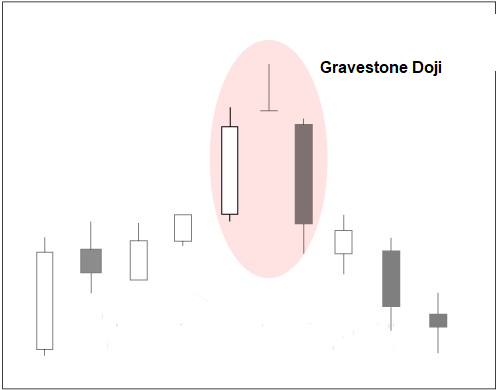
- For example, if several long growth candlesticks were formed before the doji, then the formation of a doji on the chart would mean that the strength of the bulls excised and the further continuation of the price increase is unlikely.
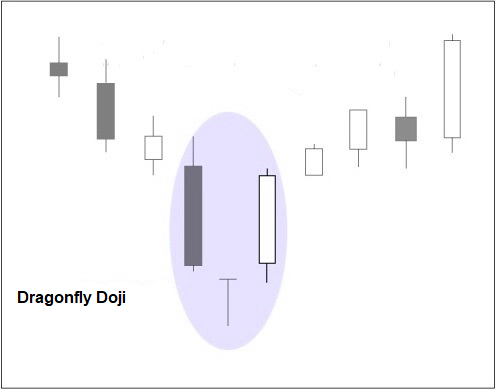
- In turn, when several long bear candlesticks are formed on the market, after which a doji was formed on the chart, we can say that bears are getting weaker and it is time for the bulls to seize the initiative.
In reversal patterns, long-legged dojes play a significant role, the long shadow of which is directed in the direction of the trend, while the short shadow should be rather small or absent.
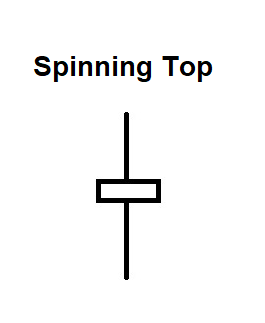
A spinning top is a candlestick with a small body and long shadows, and the color of the body of the candlestick is irrelevant. The small body of the candlestick indicates that the opening price is slightly different from the closing price at a certain time interval, while the long shadows of the top indicate that the choice of sellers and buyers is ambiguous. Formation of a spinning top on a chart means a slowdown in price movement along a trend, and the formation of two or more spinning tops is a strong reversal signal.
Note. When trading on the market with the use of candlestick patterns, and in our case it is the formation of a spinning top or doji, you should always wait for confirmation of the change in price movement in the market. For example, to enter the market for sale, after the formation of a doji or spinning tops, it is worth waiting for the formation of a falling candlestick and enter the market at its close.
The entry will be similar to the purchase, while it is worth waiting for the growth candlestick and to enter the market at its close.
If you want to get acquainted with candlestick patterns and their analysis more detailed you can take a course with specialists of Еster Holdings Inc.
Alexander Sivtsov