
The main market’s drivers
- US Goods trade balance of (July), fact -72.20B, forecast -68.60B.
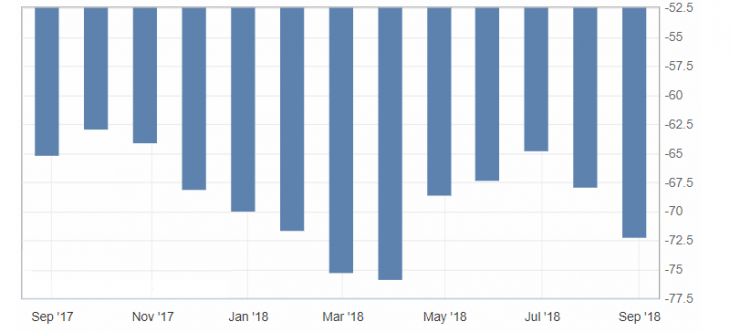
US goods trade balance chart
The US goods trade balance unexpectedly increased the deficit, thereby closely approaching the minimum values of the current year, which were traced in February and March, which is a negative factor against the backdrop of a tough trade confrontation.
The dynamics of the dollar index, in turn, remains restrainedly negative, which is connected with the reduction of risks around the US trade confrontation. The support zone for the dollar index is the level of 94.60-50. But in conditions of continuing dynamics a test of support levels is possible: 94.30 and 94.00 in the next few days.
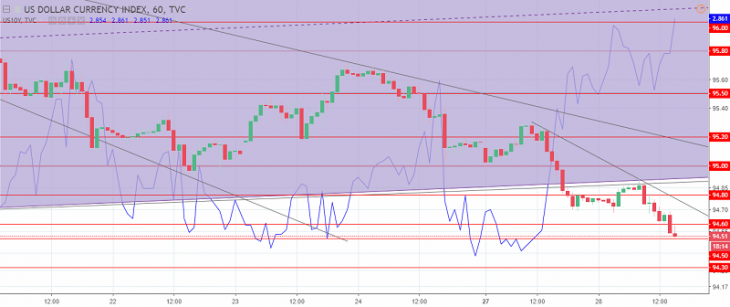
The US dollar index chart. The current price is 94.50 (10-year government bonds yield is a blue line)
Read also: “Fundamental analysis: Inflation and the impact of its indicators on world currencies”
Andre Green
Earn with the help of the trade service on the news Erste News!
Topical articles of the trader’s blog:
- Trade balance influence on the country’s economy
- Stock indices : Asia-Pacific region
- Collapse of the Turkish lira. A threat to the market!
Current Investment ideas: