
Oil Technical Analysis (Alexander Sivtsov)
Oil is trading near zero marks during the Asian session.
Brent (current price: $ 5792.6 per 100 barrels)
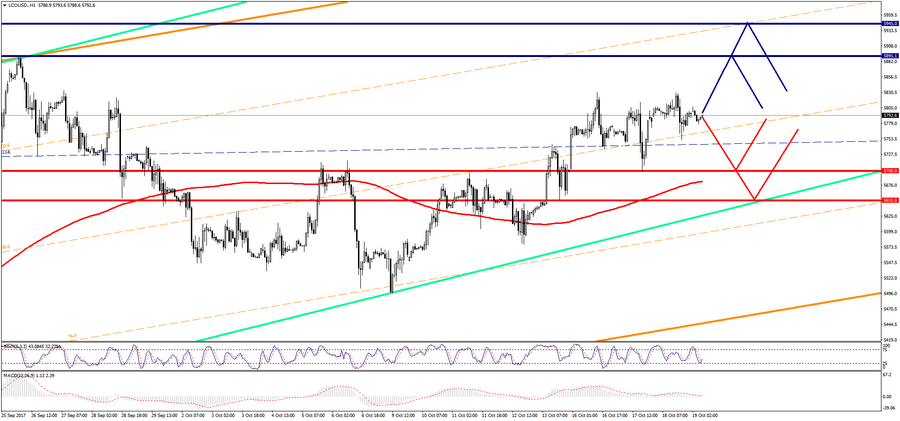
Brent is trading in a narrow range during the Asian session.
Resistance 1: From $ 5891.10 (maximum of September 26)
Resistance 2: From $ 5945.00 (23.6 level Up of the Fibonacci channel on H4)
Support 1: From $ 5700.00 (psychological level)
Support 2: With $ 5651.00 (line of support Up on H1)
Computer analysis: The movings of the Stochastic Oscillator indicator on the price chart of D1 are in the overbought zone. Also, according to the MACD indicator on the D1 chart, a bearish divergence is formed, against which the possibility of reducing the Brent price remains.
WTI (current price: $ 5222.2 per 100 barrels)

WTI is trading near the zero mark during the Asian session.
Resistance 1: From $ 5,290.70 (maximum of September 28)
Resistance 2: From $ 5400.00 (psychological level)
Support 1: From $ 5100.00 (psychological level)
Support 2: From $ 5039.60 (minimum of October 12)
Computer analysis: Just like Brent, on the D1 chart, Stochastic Oscillator movings are in the overbought zone. The MACD indicator on the D1 chart forms a bearish divergence, which is why one should expect a decrease in the price of the WTI.