
New possibilities of the good old RSI indicator. Anton Hanzenko.
The Relative Strength Index indicator does not require unnecessary representations, since it is well known for a wide range of traders. RSI is a fairly old indicator and is used by many to identify potential overbought and oversold conditions in the market.
Today we will try to look at this tool from a slightly different angle. RSI is known as an oscillator for determining overbought and oversold, this is a classic use of an oscillator. But it also has less known properties of trend indicators, which can also help in determining local levels of support and resistance.
Focusing on the local extremes of the RSI indicator, one can identify the main significant levels on the main price chart, thanks to which we enter into a deal in the direction of the main trend, waiting for a break or break through these levels.
In addition to the levels of support and resistance, local extremes of the RSI indicator show an existing trend or its possible changes, which allows you to enter the transaction at a best price.
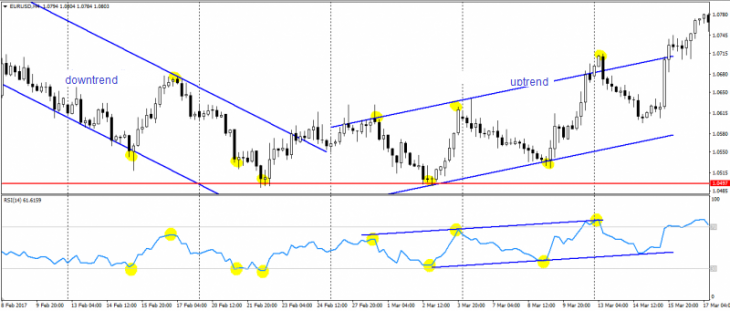
The figure above shows an example of a trading strategy for the RSI indicator, where yellow circles denote local extremes of the indicator with a price displayed on the chart. Also on these points are the trend lines.
The last two points of the downtrend are in the oversold zone, which already serves as a signal to buy. And two local lows in the oversold zone serve as entry points to break through and support. The exit point is the first local uptrend high.
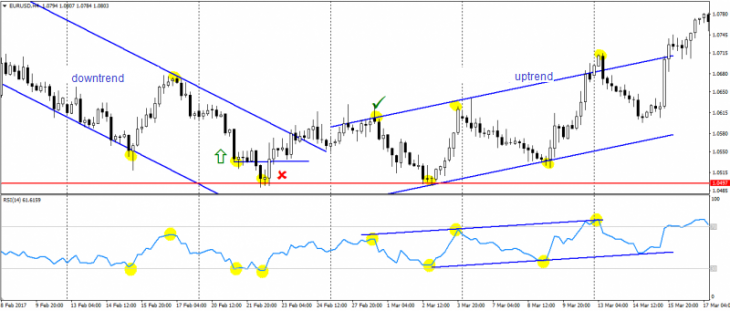
In addition to the entry and exit points, the indicator indentified a reversal in advance, as indicated by the location of the first three points of the uptrend. This uptrend is also outlined on the RSI indicator itself.
The Relative Strength Index indicator settings can be used by default or selected individually for each trading instrument depending on the goals and timeframes.
Of course, this indicator with a similar approach couldn’t be used as a full-fledged trading strategy due to possible false signals and ambiguity. However, the approach, like the indicator itself, can be widely used in most trading strategies. In addition, it certainly will not be superfluous in strategies that are based on trading according to levels of support and resistance.
You can learn more about the indicator and not only about it from the courses offered by Ester Holdings Inc.
Anton Hanzenko