
Technical Analysis of Oil (Alexander Sivtsov)
Oil shows mixed dynamics during the Asian session.
The Brent graph (current price: $ 6313.00 per 100 barrels)
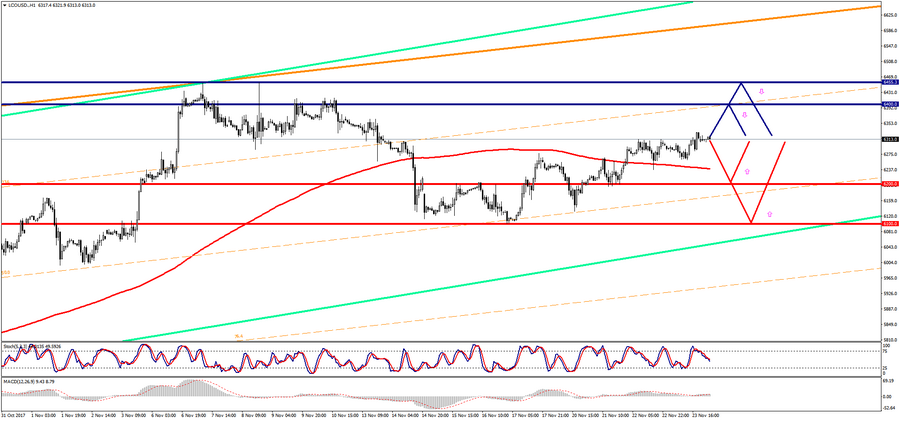
Brent is trading below the zero mark during the Asian session.
- Resistance 1: From $ 6400.00 (psychological level)
- Resistance 2: From $ 6455.30 (November 8 maximum)
- Support 1: From $ 6200.00 (psychological level)
- Support 2: From $ 6100.00 (psychological level)
Computer analysis: The Stochastic Oscillator movings on H4 chart indicate the overbought of the instrument, against which the Brent price may decline.
The graph of the WTI brand (current price: $ 5838.70 per 100 barrels)
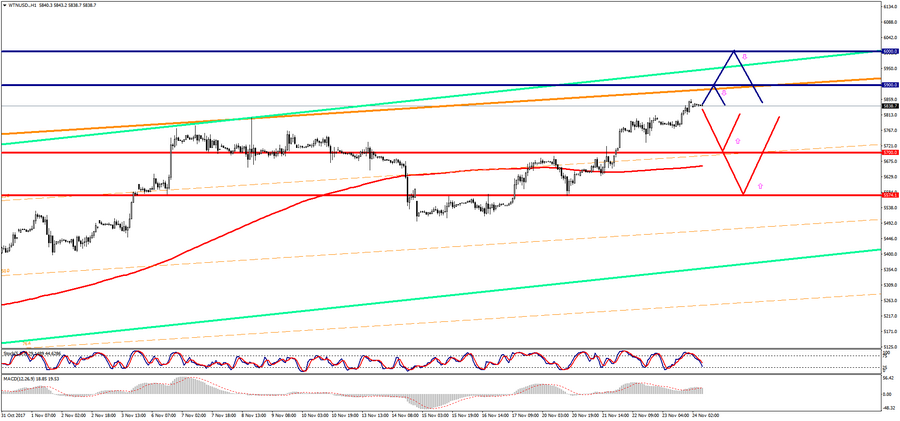
WTI is trading with a plus during the Asian session.
- Resistance 1: From $ 5900.00 (psychological level)
- Resistance 2: From $ 6000.00 (psychological level)
- Support 1: From $ 5700.00 (psychological level)
- Support 2: From $ 5574.10 (November 20 minimum)
Computer analysis: The Stochastic Oscillator movings on H4 chart indicate the overbought of the instrument, which is why a downward correction of the WTI brand price is possible.