Fibonacci lines and trade in crypto currency. Application. Alexander Sivtsov.
In one of my articles I talked about the use of classical technical analysis for trade in crypto currency and how it differs from the application for trade in the foreign exchange market. More “Technical Analysis of Crypto-Currency. The main differences and similarities with the currency market.” In this article, we will understand how the most universal and accurate tools for the technical analysis – Fibonacci Lines behave while trading in crypto currency.
Fibonacci lines in trade. Application.
Fibonacci lines are a series of numbers in which the ratio of the smaller number to the next greater equals 1.618.
In trading, Fibonacci lines are used for:
- determination of the level of price correction, which you can read about in my article on the theory of the golden section,
- determination of the potential for further price growth,
- trading in flat when the price moves between significant levels of Fibonacci lines.
The main difference between the use of Fibonacci lines when trading in the crypto currency market is only that it is necessary to trade with the use of this instrument of technical analysis in the direction of growth, since the crypto-currencies mainly maintain an upward trend.
Trading on Fibonacci lines
Those who have already read my article on the theory of the golden section know that the Fibonacci tool uses such basic levels as: 0; 23.6; 38.2; 50.0; 61.8; 100. As almost on all major crypto-currencies an uptrend is traced, naturally, priority should be given to transactions for purchase from the basic levels of correction of the “Fibonacci Lines”. The levels are 23.6 and 38.2.
Building Fibonacci Lines and Entering a Transaction
- As practice shows, in the use of “Fibonacci Lines” when trading in Bitcoins, the construction of lines should start not from the lowest point of the formed movement on a certain segment of the chart, but from the lowest point of the consolidation zone, after which the price went to growth to the upper value of the price.
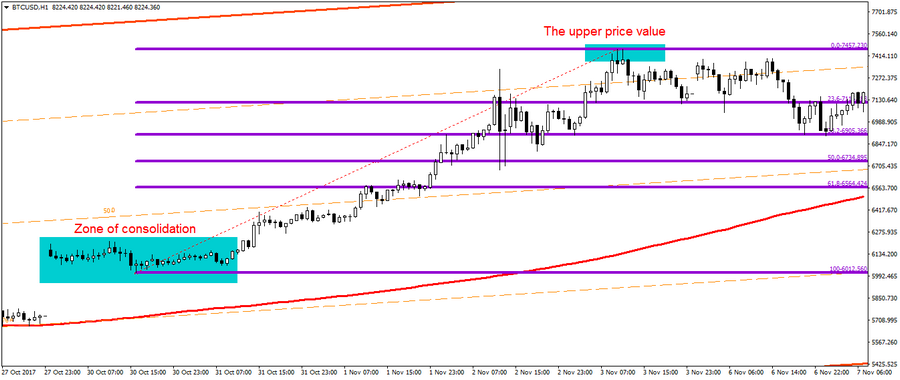
Fig.1 BTC/USD chart
- The entrance to the purchase is possible at the moment when the price of the instrument returns to the basic correction levels of the Fibonacci lines, namely to the levels of 23.6 and 38.2. It is worth noting that, as well as when trading in the foreign exchange market, trading from the level of 23.6 is considered more aggressive than from the level of 38.2.
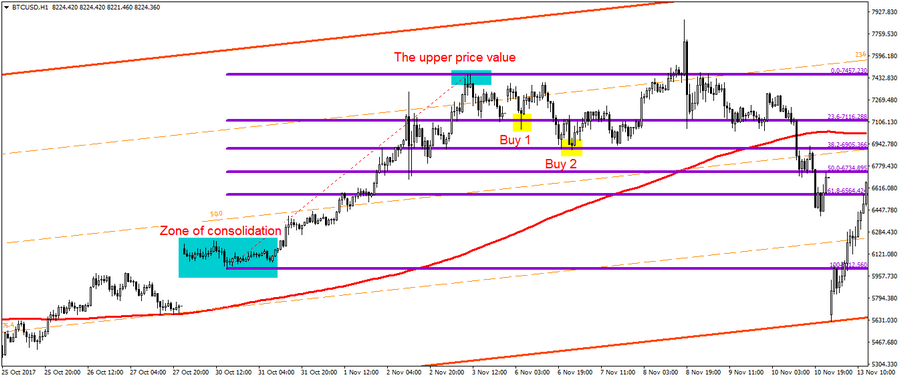
Pic.2 BTC/USD chart
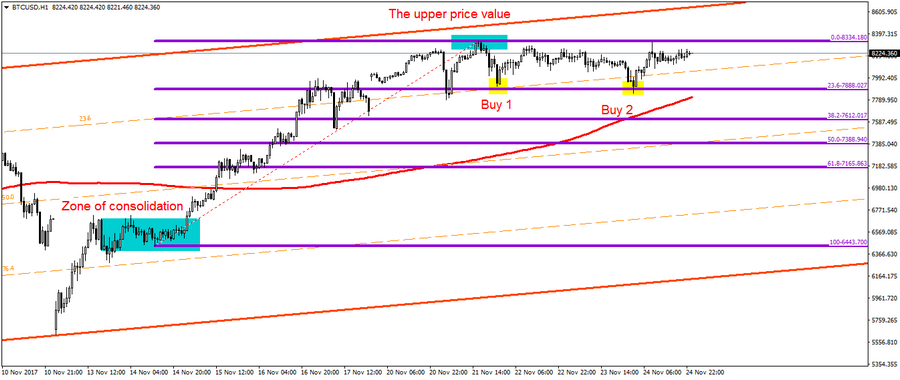
Pic.3 BTC/USD chart
Conclusion
To sum up, it is worth noting that contrary to a significant number of articles on the Internet that the trade in crypto currency is significantly different from trading in the foreign exchange market, the use of “Fibonacci Lines” is an excellent technical analysis tool that works well in any financial market, including the market for crypto currency.
Alexander Sivtsov