Fractals. Another simple indicator for earnings!
Trading using fractals or so-called fractal strategies for a long time has been a subject of interest to traders and disputes between them. At the same time fractals in trade continue to be used to this day and quite often despite a very long history and a number of shortcomings.
Bill Williams introduced the concept of “fractal” in the financial markets. He described a trading strategy that included a system of fractals and the Alligator indicator. This strategy is also described here.
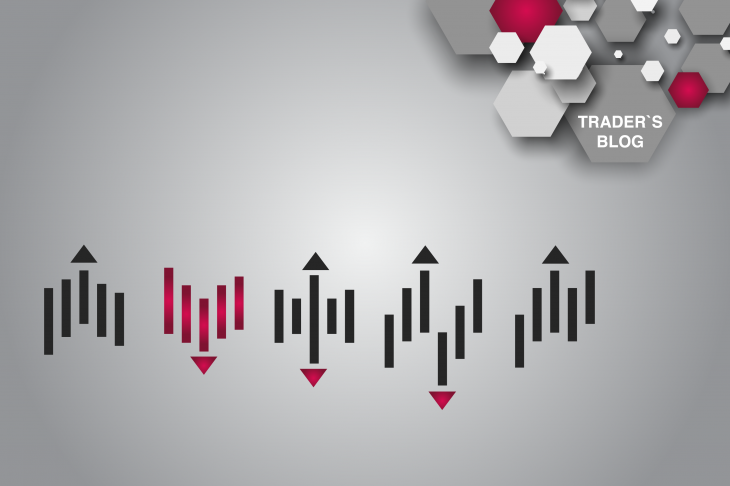
Fractals are some patterns of at least 5 candlesticks and Williams systematized them, thus describing the trading strategy for them.
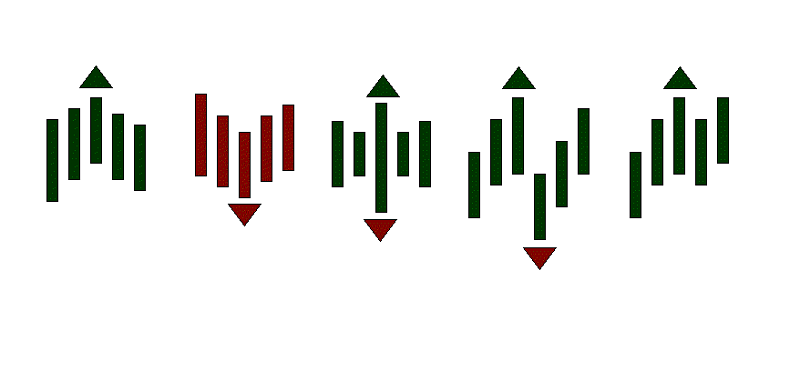
The green triangle is a fractal up, the red triangle is a fractal down.
At the same time, fractals don’t indicate a clear direction after formation, as is usual in patterns or figures in the market. In fact, fractals indicate the extremes of the five candlesticks of the market, which are later used for breakthrough (penetrative) strategies. The fractal is considered as an important price level.
Fractal trading methods:
- Fractal breakdown
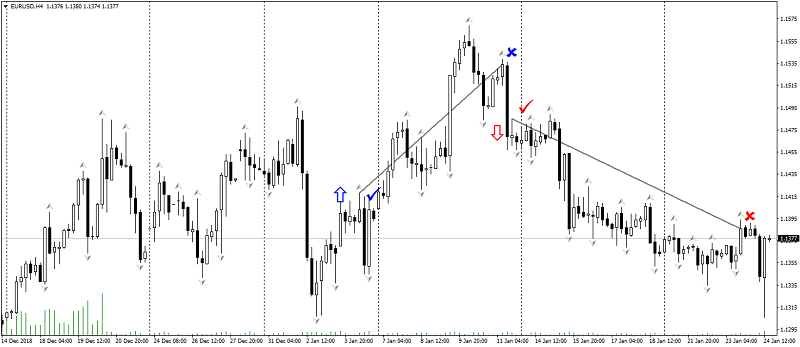
Breaking through fractals is a classic method of using it, which was described by author Bill Williams. It is the entry in trade on breaking through fractals and continuing movement in the same direction. The stop is located behind the opposite fractal and moves as the fractals form.
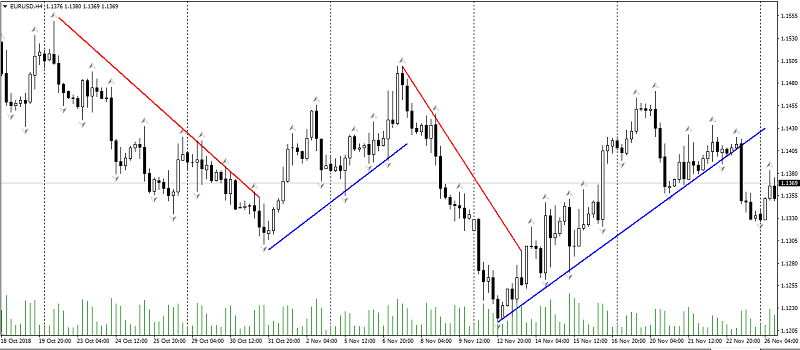
- Fractals and trend lines
A less common method of using fractals is defining a trend. Building a trend for fractals is much simpler, especially for a trader – beginner, and much more efficient, allowing you to react in time to a trend change.
- Fractals and support/resistance levels
Fractals should be used as support and resistance levels taking into account a timeframe. So, if you are trading on H1, then support and resistance levels on fractals should be set on the H4 or D1 timeframe. If you are trading on M5, the levels of support and resistance on fractals should be set on the M30 or H1 timeframe. Since the levels of support and resistance on fractals on one timeframe will not be effective.
- Fractals disadvantages
The main disadvantage of fractals is their frequency of formation every 5 candlesticks, which often gives false signals. Therefore, they are used in conjunction with filtering strategies or as an auxiliary indicator.
A fractal can give ambiguous signals. So, fractals work well in a clear traced trend and much worse in the flat. Therefore, they should be used on higher timeframes, which significantly reduces false signals and allows you to assess the situation more clearly.
- Fractals do not predict goals.
This feature is worth considering.
In conclusion, it should be said that the fractal is a very versatile tool that is indispensable for a trader-beginner. At the same time they should be used together with other strategies and indicators.
Anton Hanzenko