
Stock indices: the US market
Often in the economic literature or in reviews of a particular economy, the concept of stock indexes occurs. There is a huge variety of definitions of stock indices as well as the indices themselves. Stock indexes – it is a mathematical indicator of the dynamics of stocks, included to this index, which can be calculated using different methods. Since the stock index is an indicator of the dynamics of several significant stocks, the change in this indicator over time plays a significant role.
So, individual stock indices or whole groups of indices can express with a high degree of confidence the state of the economy to which they relate, thereby allowing to more easily judge the dynamics of changes in a particular world economy.
Today we will talk about the largest stock market, the US market and its indices, what role they play for the American currency, for the market and for the global economy as a whole.
Stock indices formation
One of the first stock indexes was developed by the WallStreetJournal newspaper in 1884 in the US and named after the DowJones. At the time of creation, this index included 11 transport companies, but with the time it changed, like the shares included in it. This index exists and still has many variations.
US stock indices
Since the US stock market is one of the largest in the world, then there are plenty of US stock indices. We will look at the most popular and influential stock indices.
DOW 30 – the stocks included in the index are called “blue chips”. It includes 30 branches except municipal and transport. DOW is one of the major stock indexes.
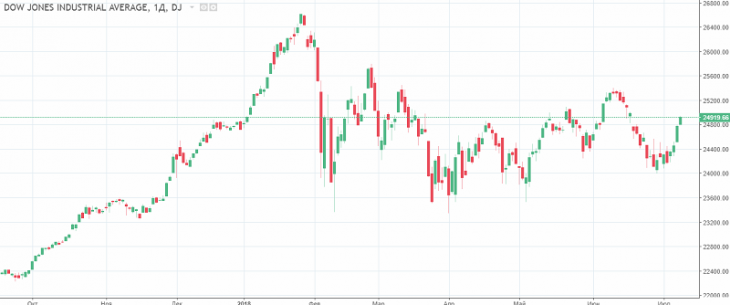
Fig. 1. DOW 30 index chart
The S & P 500 is an index that includes 500 US companies with the largest capitalization, which represent about 75% of the entire US stock market. As a result, this index can act as a conditional indicator of market capitalization.
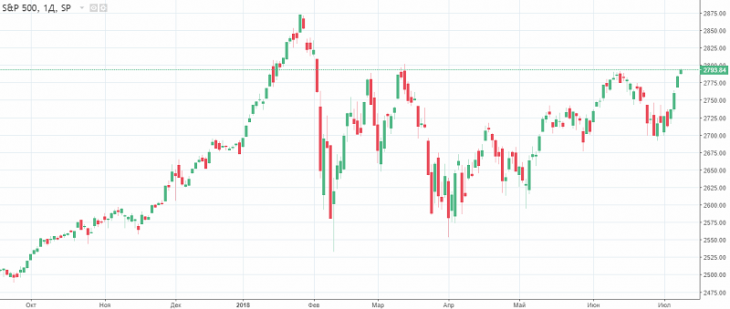
Fig. 2. S & P 500 index chart
NASDAQ is an index that includes all stocks traded on NASDAQ. It includes 3,000 companies, both as from the US and so as from other countries. This index is considered a reflection of the state of shares of global technology companies.
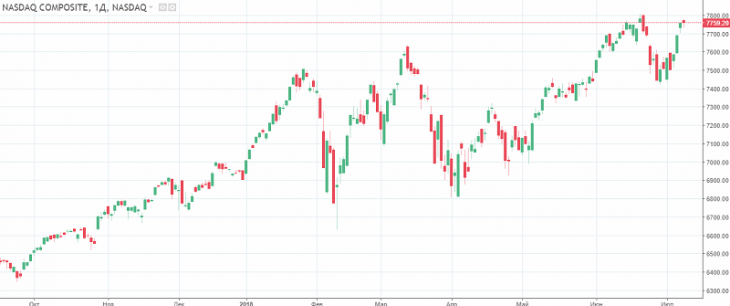
Fig. 3. NASDAQ index chart
Correlation of stock indices
Correlation in the stock markets and between the stock indices is one of the highest. And on one platform, it almost always remains very high, which allows you to predict the dynamics of background indices with a high degree of confidence.
With the US national currency, the stock indices have a negative correlation, which serves as an excellent leading indicator for trading on the US currency.
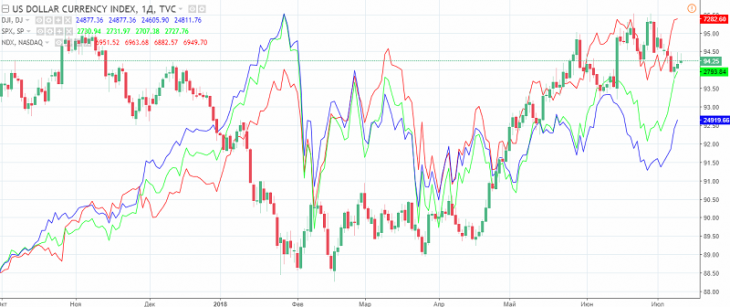
Fig. 4. The US dollar index and stock indices (DOW 30 – blue line, S & P 500 – green line, NASDAQ – red line) chart
In the next article, devoted to stock indices, let’s consider the dynamics of European stock indices. And in order not to miss important information, follow Expert’s Opinions and the Trader’s Blog.
Anton Hanzenko