
Data on durable orders in the US
- Core durable goods orders (m/m) (Feb), fact 0.1%, forecast 0.3%.
- Durable goods orders (m/m) (Feb), fact -1.6%, forecast -1.1%.
Data on durable orders in the United States declined in February, indicating the continued negative dynamics of this indicator and the symptoms of a slowdown in the US economy. In addition, it is worth noting the decrease in the amplitude of this indicator, which can be regarded as a slowdown in the US market.
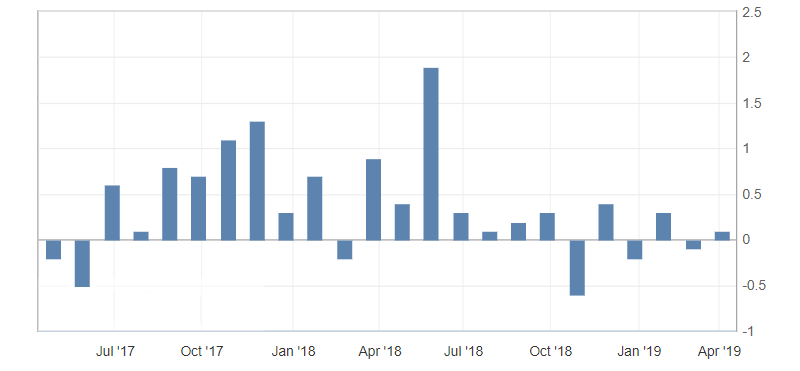
U.S. durable goods orders chart
The US dollar index reacted very cautiously to published statistics. At the same time, the dynamics of the US dollar and the market as a whole remain very restrained. As a result, the US dollar index is limited to a restrained strengthening slightly above the opening of the day, confirming the safety of the upward trend and adjusting against continued growth. Resistance levels: 97.50 and 97.70, support: 97.20 and 97.00.
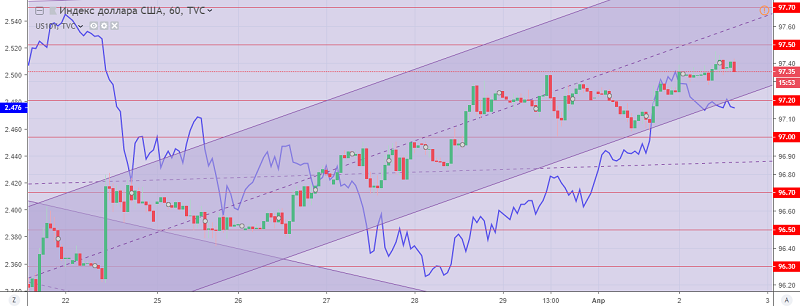
The US dollar index chart. The current price is 97.40 (10-year government bonds yield is the blue line)
Reas also: “The political crisis in Venezuela and its inpact on the markets”
Hanzenko Anton
Earn with the help of the trade service on the news Erste News!
Topical articles of the trader’s blog:
- World central banks are preparing for lower rates
- Financial quarter correction
- Prospects for the euro based on the ECB policy
Current Investment ideas: