
U.S. data
- Core price index for personal consumption expenditures (y/y) (oct), fact 1.8%, forecast 1.9%.
- Core price index for personal consumption expenditures (m/m) (oct), fact 0.1%, forecast 0.2%.
- Initial jobless claims, fact 234K, forecast 221K.
- Personal spending (m/m) (October), fact 0.6%, forecast 0.4%.
The US data was largely negative due to a slowdown in growth in spending on personal consumption and an increase in applications for unemployment benefits, which ultimately indicates the possibility of a slowdown in US inflation and employment.
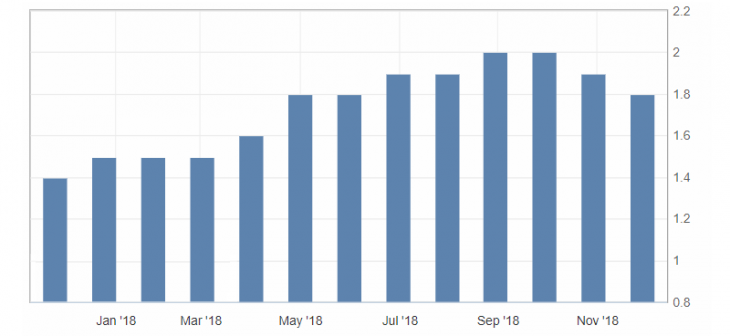
Fig. 1. Core price index for personal consumption expenditure (y/y)
Despite the weak US data, the US dollar index reacted very discreetly to published statistics, trading under pressure from the growth of optimism and statements by the US Federal Reserve Chairman, thereby forming a side channel from 97.00 to 96.60.
The market and the US dollar index is waiting for the FOMC meeting minutes, which will be released today. At the same time, the market expects hints about the Fed future monetary policy, or rather, the answer to the question: will the Fed continue to raise interest rates in 2019? The dollar index is limited by lateral dynamics near the lower boundary of the upward channel.
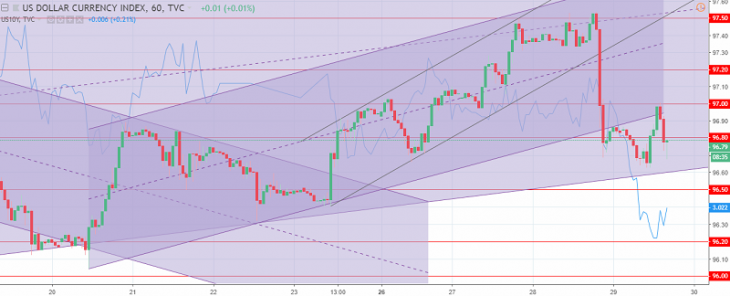
The US dollar index chart. The current price is 96.80 (10-year government bonds yield is the blue line)
Read also: “Durable Goods Orders in the USA”
Hanzenko Anton
Earn with the help of the trade service on the news Erste News!
Topical articles of the trader’s blog:
- Expectations from the NZD/USD pair at year’s end!
- An engulfing strategy. A Trend reversal.
- Gold is limited to annual correction! What to expect?!
Current Investment ideas: