
US data
- Initial jobless claims, fact 201K, forecast 210K.
- Philadelphia Fed manufacturing index (Sept), fact 22.9, forecast 17.0.
- Philadelphia Fed employment index (Sept), fact 17.6, previous value 14.3.
The US data were very positive with the update of the historical minimum for initial jobless claims. It is worht to note that there is a significant increase in manufacturing activity in Philadelphia.
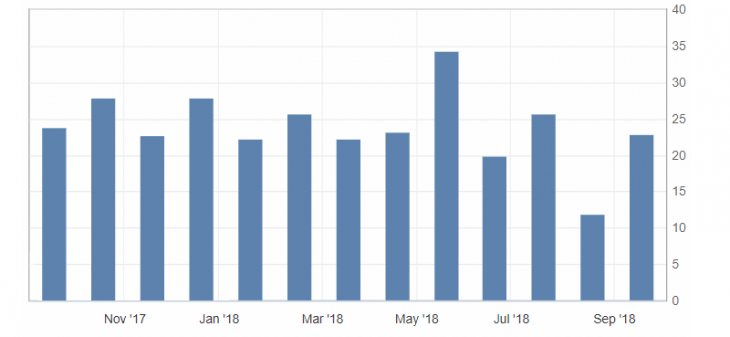
Fig. 1.Philadelphia Fed manufacturing index chart
The indicator rose in September from the lows of the last year, thereby partially returning optimism to the American.
The US dollar index slowed down on the publication of this block of news after a sell-off on the growth of optimism in the market. The US dollar index is oversold and limited to the lower border of the downward channel. As a result we should expect correction from support levels: 94.00 and 93.80.
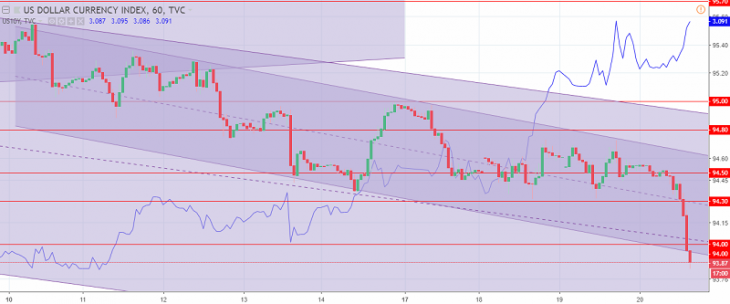
Fig. 2. The US dollar index chart. The current price is 93.90 (10-year government bonds yield is a blue line)
Read also: “VSA analysis – about the main in short”
Hanzenko Anton
Earn with the help of the trade service on the news Erste News!
Topical articles of the trader’s blog:
- Prospects for the dollar by the end of September beginning of October 2018
- The EU and the UK are making compromises on Brexit
- Singapore dollar. Features of trade.
Current Investment ideas: