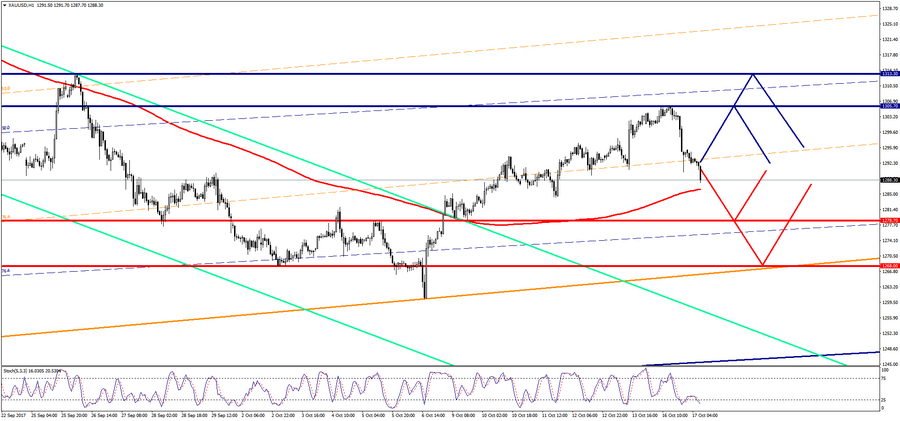
Technical analysis of currency pairs (Anton Hanzenko)
EUR USD (current price: 1.1770)
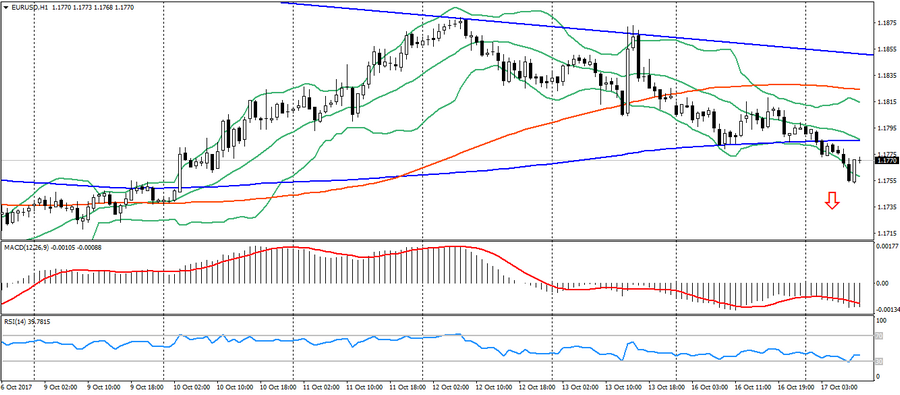
- Support levels: 1.1700 (the maximum of August 2015), 1.1600 (the maximum of 2016), 1.1470.
- Resistance levels: 1.2000, 1.2100, 1.2270 (the minimum of November 2014).
- Computer analysis: MACD (signal – downward motion): the indicator is below 0, the signal line in the body of the histogram. RSI in the neutral zone. Bollinger Bands (period 20): oversold, growing volatility.
Oil Technical Analysis (Alexander Sivtsov)
Oil is trading above the zero marks in the Asian session.
Brent (current price: $ 5765.8 per 100 barrels)
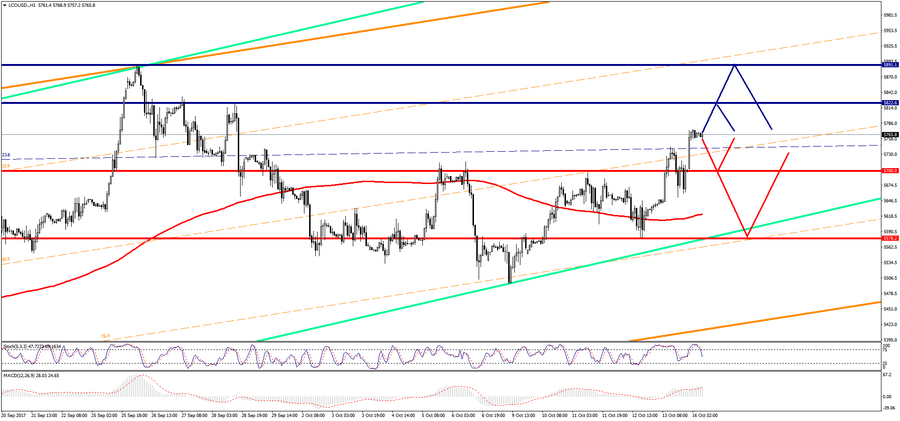
Make Brent is trading above the zero mark in the Asian session.
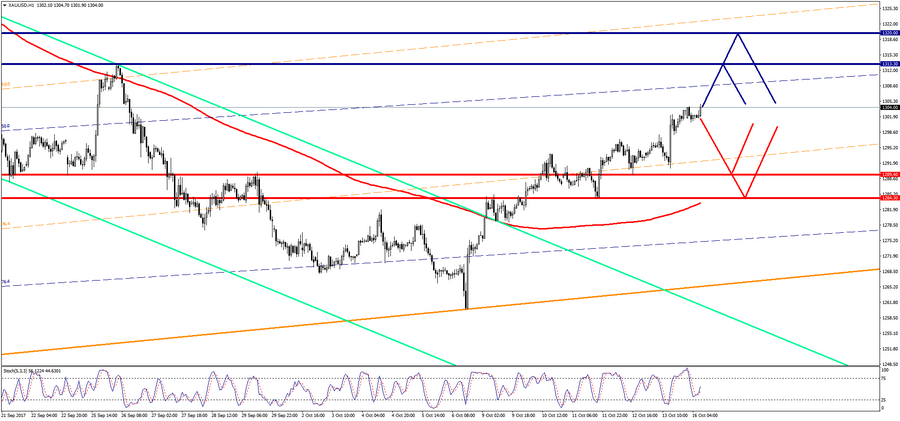
Technical analysis of currency pairs (Anton Ganzenko)
EUR USD (current price: 1.1790)
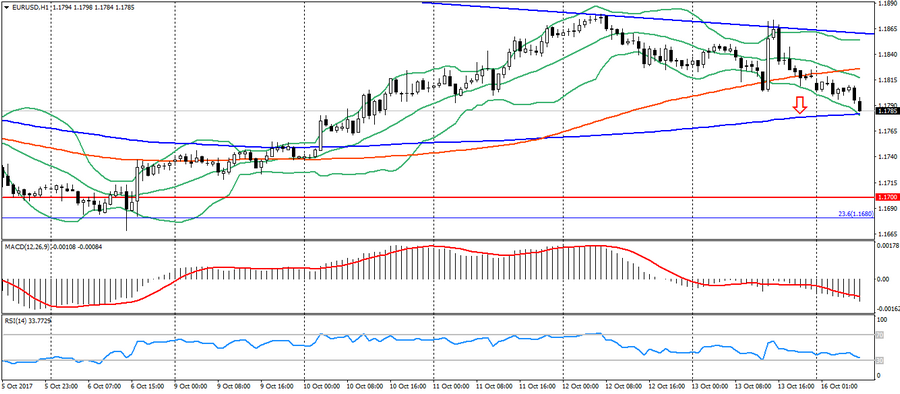
- Support levels: 1.1700 ( the maximum of August 2015), 1.1600 ( the maximum of 2016), 1.1470.
- Levels of resistance: 1.2000, 1.2100, 1.2270 ( the minimum of November 2014).
- Computer analysis: MACD (signal – downward motion): the indicator is below 0, the signal line in the body of the histogram. RSI in the oversold zone. Bollinger Bands (period 20): neutral, growing volatility.