
The main patterns for making money in the financial markets! Part 1. Anton Hanzenko.
The financial market, whether it is the stock, bond, commodity, Forex or any other market where financial assets are traded, is a multifaceted and ever-changing organism. There are many approaches and techniques or the study and analysis of it. One of the effective and time-tested methods of technical analysis of the financial market is the figures or patterns, which will be discussed.
Head and shoulders
Head and shoulders – is a classic trend reversal model and consists of three waves: the first wave forms the left shoulder, the second wave forms the head, the third wave forms the right shoulder. On the opposite side, the figure Head and shoulders are limited by the neck level.
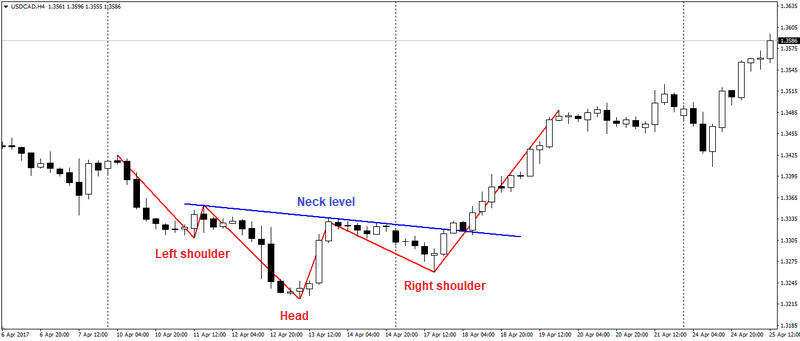
The figure shows an example of an inverted pattern Head and shoulders, which signals an uptrend. For a downtrend, the Head and shoulders pattern should form a similar model with a mirror image, where the head is above the neck.
A signal to enter the deal on the Head and Shoulders pattern is breaking through at the price of the neck level. Often, after breaking through the neckline, the price returns to this level and fights off of it. The goal for the deal is equal to the distance from the head to the neck level.
Double Top / Double Bottom Pattern
A double top / double bottom is actually the same pattern with a mirror image, or as they are also called W and M models. A double top / double bottom is a trend reversal pattern and represents two consecutive extrema that form peculiar W and M models on the price chart.
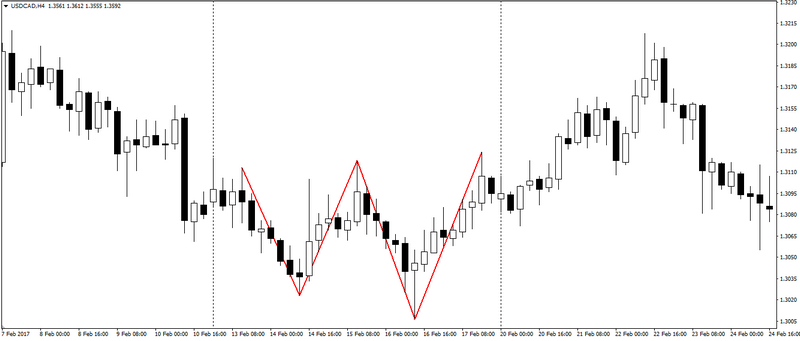
The figure shows an example of a double bottom or W – model. As a rule, the highs for the double top and the lows for the double bottom are approximately at the same level. Ideally, it is believed that for a double bottom, the left minimum should be slightly lower than the right, and for a double top, the left maximum should be higher than the right, but this condition is not always satisfied.
A signal for entering a trade for the W – model is the price breaking through the level of the maximum of the pattern, for the M – model – the minimum. The goal in the figure is equal to the distance from the smallest maximum to the minimum for the M – model, delayed from the breakdown point. For the W – model, a similar method is used, only the distance from the lower minimum to the maximum is calculated.
Triangles
Triangles come in three forms – ascending, descending, and symmetrical.
The ascending triangle is two lines that are drawn along the local highs and lows of the price, where the upper resistance line is almost horizontal or horizontal and the lower one forms an upward slope.
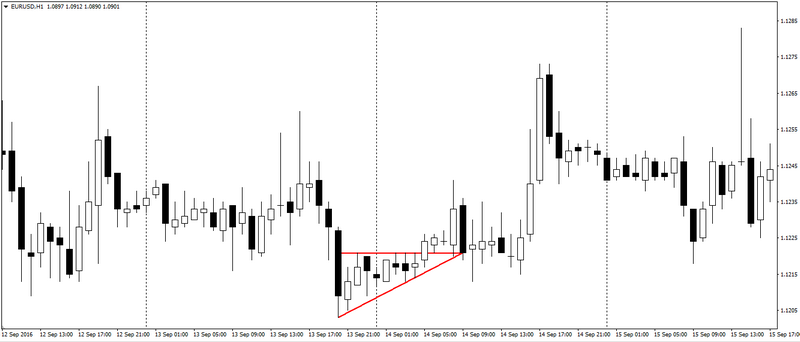
The entry into the deal on the Ascending Triangle is breaking through the resistance line. The goal is equal to the distance of the widest point of the triangle or is determined using the laid line to the support from the beginning of the formation of the triangle.
A descending triangle is a mirror image of an ascending triangle. The lower support line of the descending triangle is almost horizontal or completely horizontal, and the upper one forms a downward slope. The entry points and goals for the descending triangle are the same as for the ascending triangle, only taking into account the mirror image.
A symmetrical triangle is formed very often and is a neutral model that can be pierced in any direction, but often this happens in the direction of the current trend.
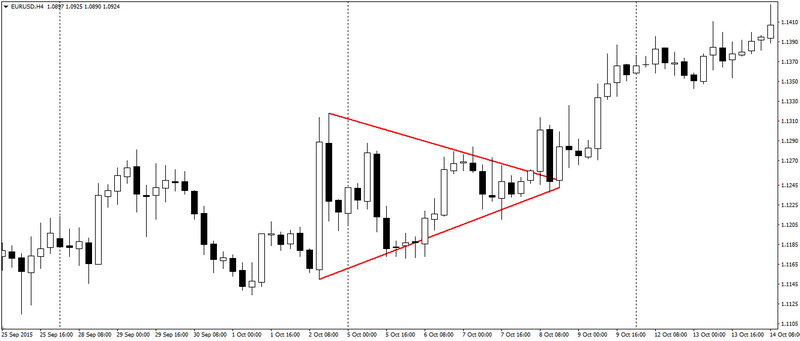
The principles of working with a symmetric triangle are the same as with ascending and descending triangles, but it is worth remembering that a symmetric triangle can be broken in any direction.
In the next part, we will talk about such important patterns as flags and very rare, but useful, formations such as: a diamond, a cup with a handle and a saucer.
Follow the Trader’s Blog. Further more!
Anton Hanzenko