
Технический анализ золота и серебра (Александр Сивцов)
График Золота (текущая цена: $1326.20)
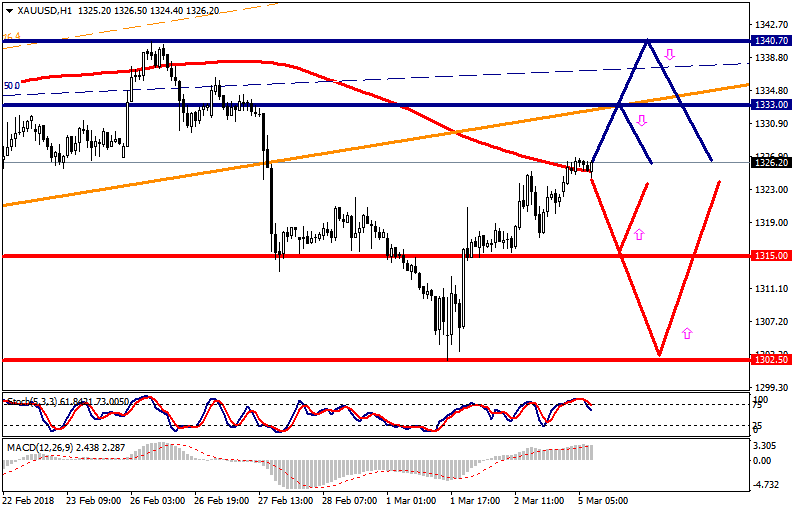
Золото торгуется выше нулевой отметки в ходе Азиатской сессии.
- Сопротивление 1: С$1333.00 (Пробитая линия поддержки Up канала на Н4)
- Сопротивление 2: С$1340.70 (максимум 26 февраля)
- Поддержка 1: С$1315.00 (технический уровень)
- Поддержка 2: С$1302.50 (минимум 1 марта)
Компьютерный анализ: Мувинги индикатора форекс Stochastic Oscilliator на графике Н4 указывают на перекупленность инструмента, на фоне чего стоит ожидать некоторого снижения цены на золото.
График Серебра (текущая цена: $16.50)
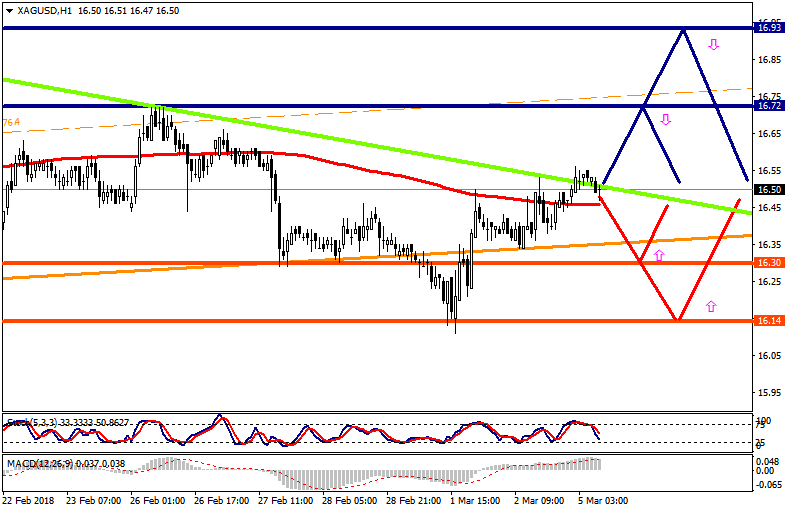
Серебро торгуется с плюсом в ходе Азиатской сессии.
- Сопротивление 1: С$16.72 (максимум 26 февраля)
- Сопротивление 2: С$16.93 (максимум 15 февраля)
- Поддержка 1: С$16.30 (технический уровень)
- Поддержка 2: С$16.14 (минимум 9 февраля)
Компьютерный анализ: По серебру мувинги индикатора форекс Stochastic Oscilliator на графике Н4 указывают на перекупленность инструмента, на фоне чего возможно снижение цены серебра.