
Технічний аналіз золота і срібла (Олександр Сівцов)
Графік Золота (поточна ціна: $ 1250.70)
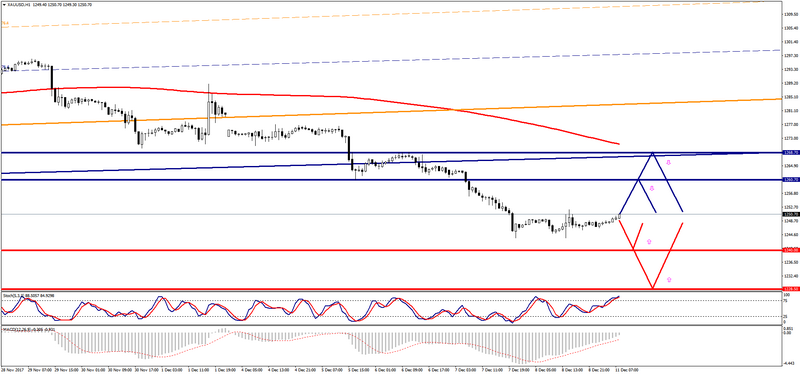
Золото торгується вище нульової позначки в ході Азіатської сесії.
- Опір 1: С $ 1260.70 (мінімум 5 грудня)
- Опір 2: З $ 1268.70 (максимум 6 грудня)
- Підтримка 1: С $ 1240.00 (технічний рівень)
- Підтримка 2: З $ 1228.50 (технічний рівень)
Комп’ютерний аналіз: мувінги Stochastic Oscillator на графіку Н1 вказують на перекупленість інструменту, на тлі чого можливе відновлення зниження ціни на золото.
Графік Срібла (поточна ціна: $ 15.83)
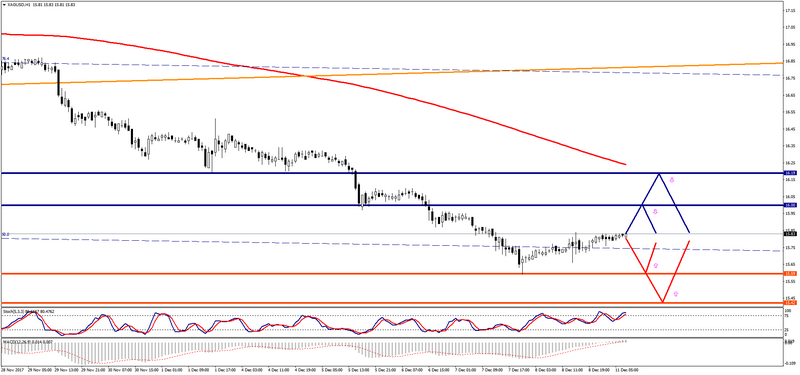
Срібло торгується з плюсом в ході Азіатської сесії.
- Опір 1: С $ 16.00 (психологічний рівень)
- Опір 2: З $ 16.19 (максимум 4 грудня)
- Підтримка 1: С $ 15.59 (мінімум 7 грудня)
- Підтримка 2: З $ 15.42 (мінімум 11 липня)
Комп’ютерний аналіз: мувінги Stochastic Oscillator на графіку Н1 вказують на перекупленість інструменту, на тлі чого можливе відновлення зниження ціни на срібло.