
Технічний аналіз золота і срібла (Олександр Сівцов)
Графік Золота (поточна ціна: $ 1282.20)
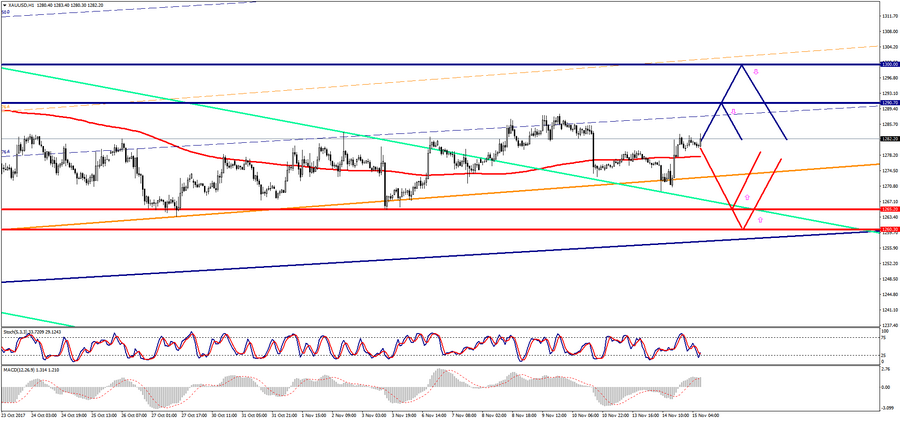
Золото торгується у вузькому діапазоні в ході Азіатської сесії.
- Опір 1: С $ 1290.70 (максимум 20 жовтня)
- Опір 2: З $ 1300.00 (психологічний рівень)
- Підтримка 1: С $ 1265.20 (мінімум 3 листопада)
- Підтримка 2: З $ 1260.30 (мінімум 6 жовтня)
Комп’ютерний аналіз: Мувінги Stochastic Oscillator на графіку Н4 входять в зону перекупленості, на тлі чого в другій половині дня можливий початок зниження ціни золота.
Графік Срібла (поточна ціна: $ 17.01)
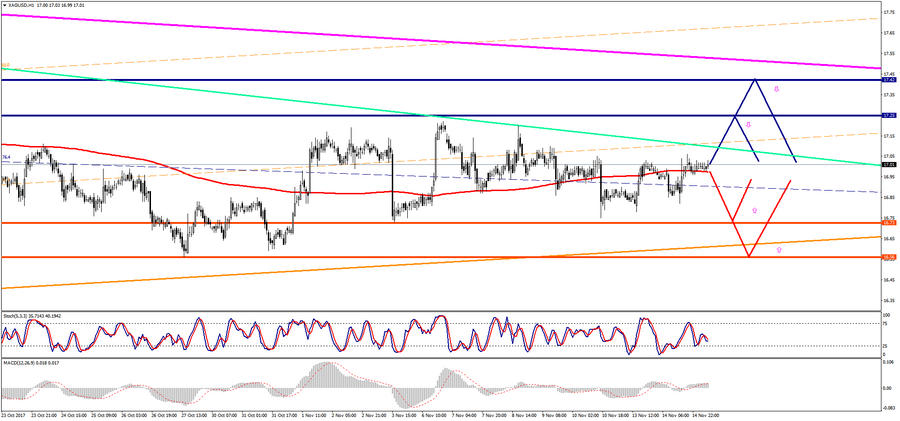
Срібло торгується з невеликим мінусом в ході Азіатської сесії.
- Опір 1: С $ 17.25 (максимум 20 жовтня)
- Опір 2: З $ 17.42 (максимум 16 жовтня)
- Підтримка 1: С $ 16.73 (мінімум 3 листопада)
- Підтримка 2: З $ 16.56 (мінімум 27 жовтня)
Комп’ютерний аналіз: Мувінги індикатора Stochastic Oscillator на графіку Н1 знаходяться в нейтральній зоні, в зв’язку з чим варто очікувати продовження консолідації ціни срібла.