
Технический анализ золота и серебра (Александр Сивцов)
График Золота (текущая цена: $1276.70)
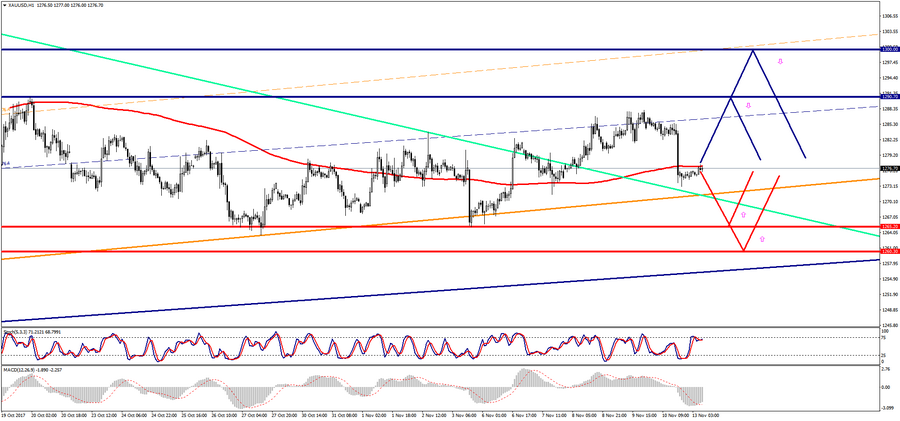
Золото торгуется в узком диапазоне в ходе Азиатской сессии.
- Сопротивление 1: С$1290.70 (максимум 20 октября)
- Сопротивление 2: С$1300.00 (психологический уровень)
- Поддержка 1: С$1265.20 (минимум 3 ноября)
- Поддержка 2: С$1260.30 (минимум 6 октября)
Компьютерный анализ: Мувинги Stochastic Oscilliator на графике Н4 указывают на перепроданость инструмента, на фоне чего стоит ожидать восстановления цены золота.
График Серебра (текущая цена: $16.87)
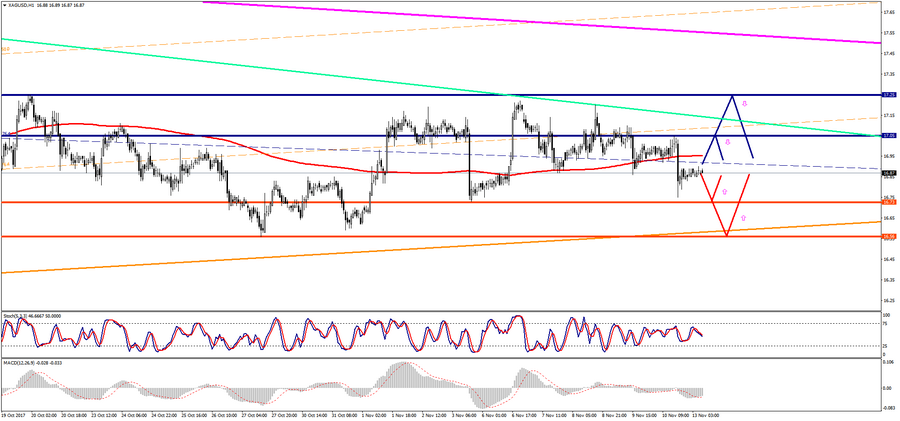
Серебро торгуется с небольшим плюсом в ходе Азиатской сессии.
- Сопротивление 1: С$17.05 (максимум 10 ноября)
- Сопротивление 2: С$17.25 (максимум 20 октября)
- Поддержка 1: С$16.73 (минимум 3 ноября)
- Поддержка 2: С$16.56 (минимум 27 октября)
Компьютерный анализ: По серебру мувинги индикатора Stochastic Oscilliator на графике Н4 находятся в нейтральной зоне, в связи с чем стоит ожидать продолжения консолидации цены серебра.