
Тechnical analysis of currency pairs (Anton Hanzenko)
EUR USD (current price: 1.1750)
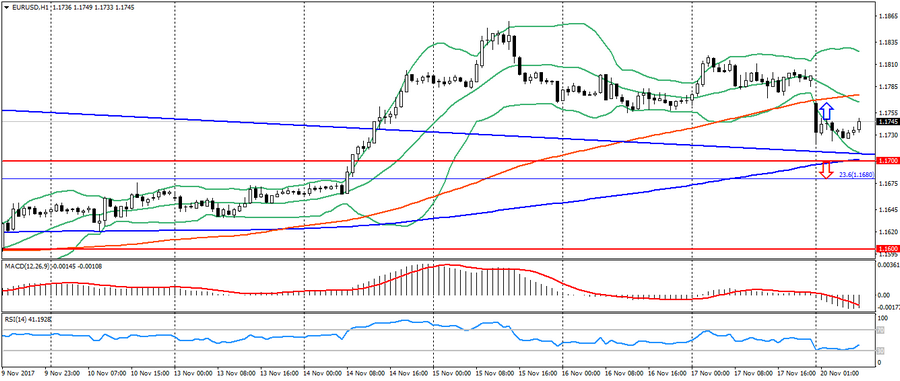
- Support levels: 1.1700 (August 2015 maximum), 1.1600 (2016 maximum), 1.1470.
- Resistance levels: 1.2000, 1.2100, 1.2270 (November 2014 minimum).
- Computer analysis: MACD (signal – downward motion): the indicator is below 0, the signal line is in the body of the histogram. RSI is in the neutral zone. Bollinger Bands (period 20): neutral, declining volatility.
- The main recommendation: sale entry is started from 1.1760, 1.1780 (MA 100), 1.1820.
- Alternative recommendation: buy entry is started from 1.1700 (MA 200), 1.1680 (Fibo. 23.6 from the low of December 2016), 1.165.
The euro is trading under pressure after a decline at the beginning of the day on the growth of political fears in Germany. The dynamics of this pair is descending, remaining near significant support levels.
GBP USD (current price: 1.3230)
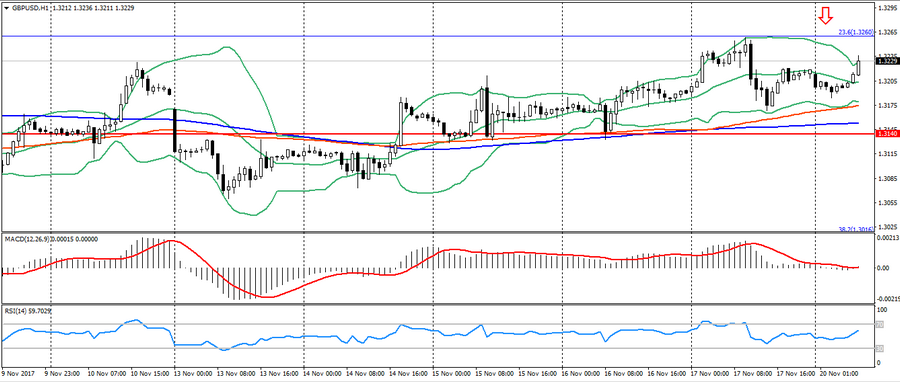
- Support levels: 1.3140, 1.2900, 1.2740 (August 2017 minimum).
- Resistance levels: 1.3500, 1.3660, 1.3830 (February 2016 minimum).
- Computer analysis: MACD (signal-flat): the indicator is near 0. RSI is in the neutral zone. Bollinger Bands (period 20): overbought, growing volatility.
- The main recommendation: sale entry is started from 1.3230, 1.3260 (Fibo. 23.6 from the January’s low), 1.3290.
- Alternative recommendation: buy entry is started from 1.3180 (MA 100), 1.3150 (MA 200), 1.3120.
The British pound is trading with a strengthening on the weakness of the euro and support through the cross EUR/GBP. The dynamics of the pair also remains limited to the lateral trend.
USD CHF (current price: 0.9890)
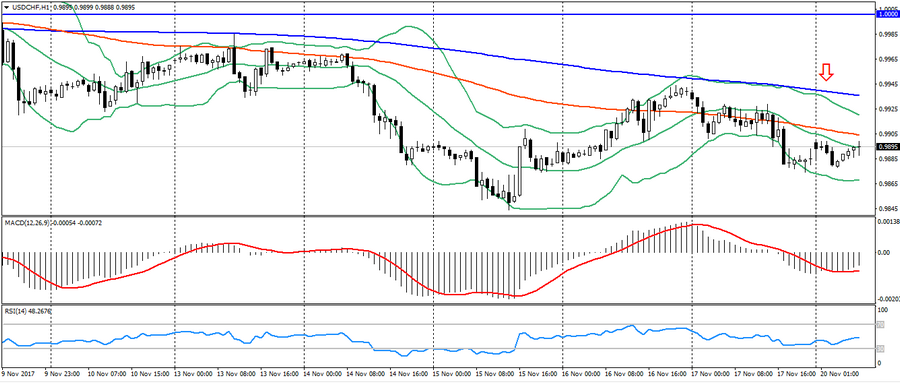
- Support levels: 0.9700, 0.9600, 0.9530.
- Resistance levels: 1.0000, 1.0050, 1.0100 (May maximum).
- Computer analysis: MACD (signal – upward motion): the indicator is below 0, the signal line is in the body of the histogram. RSI is in the neutral zone. Bollinger Bands (period 20): neutral, declining volatility.
- The main recommendation: sale entry is started from 0.9900 (MA 100), 0.9940 (MA 200), 0.9980.
- Alternative recommendation: buy entry is started from 0.9870, 0.9850, 0.9810.
The Swiss franc is trading at the opening level of the day. It is prone to decline, but maintains an upward trend.
USD JPY (current price: 111.90)
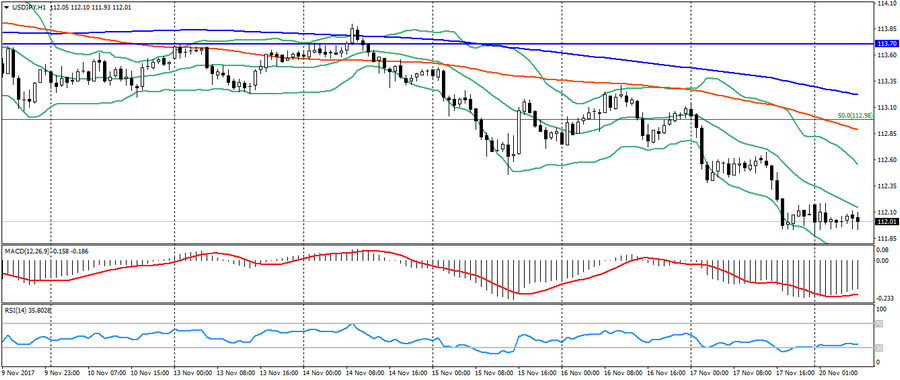
- Support levels: 108.90, 108.10 (April 2017 minimum), 107.30 (2017 minimum).
- Resistance levels: 113.70, 114.50 (July 2017 maximum), 115.00.
- Computer analysis: MACD (signal – upward motion): the indicator is below 0, the signal line has left the body of the histogram. RSI is in the oversold zone. Bollinger Bands (period 20): neutral, declining volatility.
- The main recommendation: sale entry is started from 112.40, 112.70, 112.90 (Fibo. 50.0 from the maximum of December).
- Alternative recommendation: buy entry is started from 111.80, 111.60 (Fibo. 38.2 from the maximum of December), 111.40.
The Japanese yen keeps growing on the flight of investors from risks, despite the weak data on Japan.
USD CAD (current price: 1.2780)
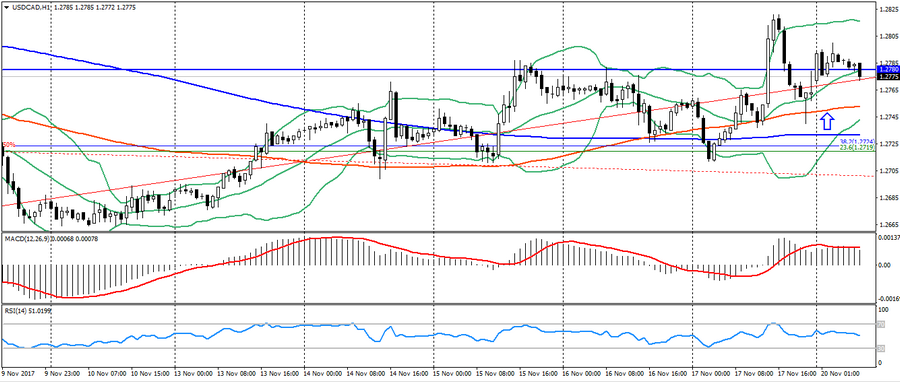
- Support levels: 1.2200, 1.2060 (2017 minimum), 1.1950 (2015 minimum).
- Resistance levels: 1.2780 (August 2017 maximum), 1.3000, 1.3160.
- Computer analysis: MACD (signal – upward motion): the indicator is above 0, the signal line is in the body of the histogram. RSI is in the neutral zone. Bollinger Bands (period 20): neutral, declining volatility.
- The main recommendation: sale entry is started from 1.2800 (MA 200), 1.2820, 1.2850.
- Alternative recommendation: buy entry is started from 1.2750, 1.2730 (MA 200), 1.2720.
The Canadian dollar is trading quite restrained at the beginning of the week based on the mixed dynamics of raw materials, but maintains a general upward trend, despite trading near significant support levels.
AUD USD (current price: 0.7560)
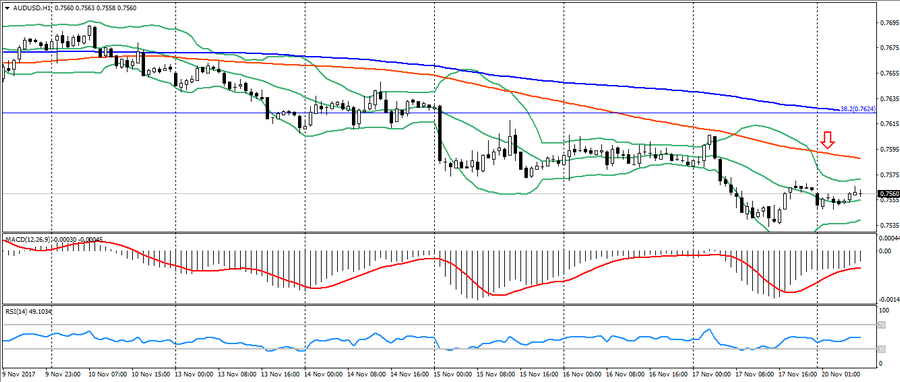
- Support levels: 0.7740, 0.7320 (2017 minimum), 0.7120.
- Resistance levels: 0.8120 (2017 maximum), 0.8200, 0.8290 (2014 maximum).
- Computer analysis: MACD (signal – upward motion): the indicator is below 0, the signal line has left the body of the histogram. RSI is in the neutral zone. Bollinger Bands (period 20): neutral, low volatility.
- The main recommendation: sale entry is started from 0.7580 (MA 100), 0.7600, 0.7630 (Fibo. 38.2 from the low of 2016).
- Alternative recommendation: buy entry is started from 0.7550, 0.7530, 0.7500.
The Australian is also trading very restrained in a downtrend due to oversold.
NZD USD (current price: 0.6820)
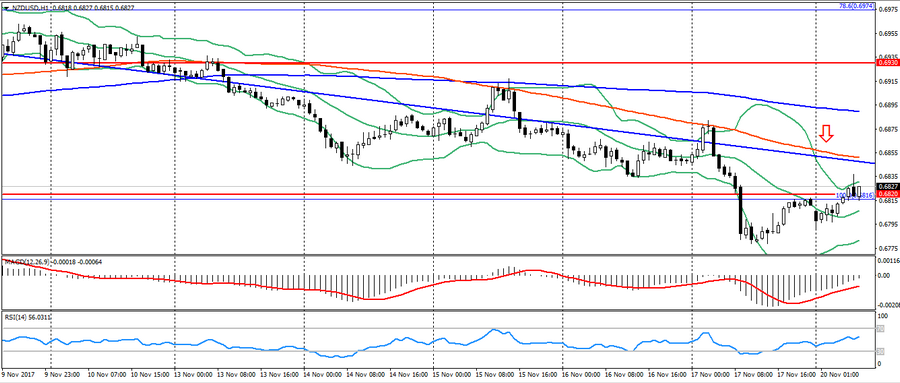
- Support levels: 0.7000, 0.6930, 0.6820 (the minimum of the current year).
- Resistance levels: 0.7380, 0.7450, 0.7550 (2017 maximum).
- Computer analysis: MACD (signal – upward motion): the indicator is below 0, the signal line has left the body of the histogram. RSI is in the neutral zone. Bollinger Bands (period 20): neutral, low volatility.
- The main recommendation: sale entry is started from 0.6850 (MA 100), 0.6880 (MA 200), 0.6890.
- Alternative recommendation: buy entry is started from 0.6830, 0.6820 (October low), 0.6800.
The New Zealand dollar is trading with the strengthening on the correction against Friday, but is limited by a downward trend.
XAU USD (current price: 1291.00)
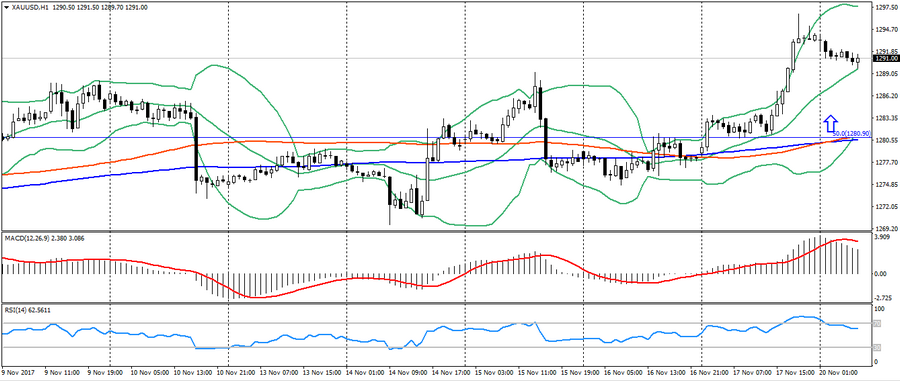
- Support levels: 1250.00, 1226.00, 1200.00.
- Resistance levels: 1340.00, 1355.00, 1374.00 (2016 maximum).
- Computer analysis: MACD (signal – downward motion): the indicator is higher than 0, the signal line has left the body of the histogram. RSI is in the neutral zone. Bollinger Bands (period 20): neutral, declining volatility.
- The main recommendation: sale entry is started from 1293.00, 1296.00, 1298.00 (Fibo. 38.2 from the July low).
- Alternative recommendation: buy entry is started from 1287.00 (MA 200), 1282.00, 1280.00 (MA 200).
Gold is also weakened on correction after the growth on Friday, but overall dynamics is rising.