
Тechnical analysis of currency pairs (Anton Hanzenko)
EUR USD (current price: 1.1600)
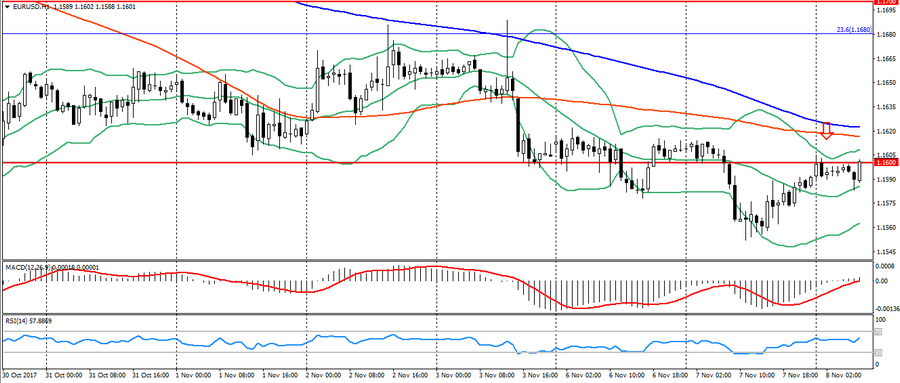
- Support levels: 1.1700 (August 2015 maximum), 1.1600 (2016 maximum), 1.1470.
- Levels of resistance: 1.2000, 1.2100, 1.2270 (November 2014 minimum).
- Computer analysis: MACD (signal – upward motion): the indicator is above 0, the signal line is in the body of the histogram. RSI is in the oversold zone. Bollinger Bands (period 20): neutral, declining volatility.
- The main recommendation: sale entry is started from 1.1600, 1.1620 (MA 200), 1.1650.
- Alternative recommendation: buy entry is started from 1.1580, 1.1550, 1.1520.
The euro is trading at the opening of the day after the multidirectional trade yesterday. Despite the fact that the pair managed to update the four-month minimum, the state of this instrument remains extremely ambiguous.
GBP USD (current price: 1.3150)
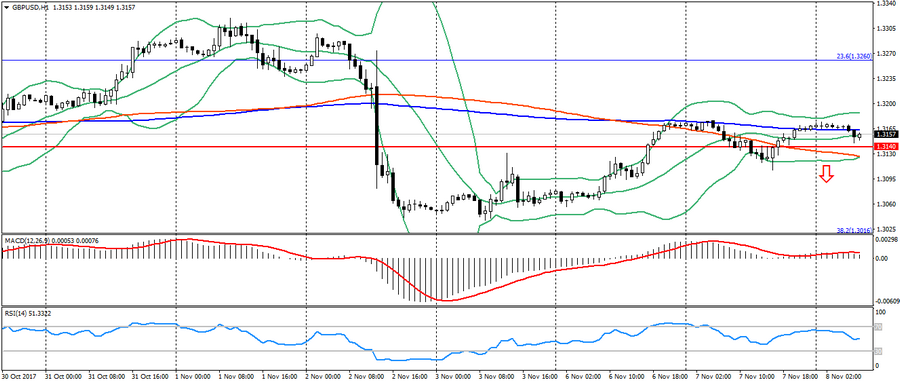
- Support levels: 1.3140, 1.2900, 1.2740 (August 2017 minimum).
- Resistance levels: 1.3500, 1.3660, 1.3830 (February 2016 minimum).
- Computer analysis: MACD (signal – downward motion): the indicator is higher than 0, the signal line has left the body of the histogram. RSI is in the neutral zone. Bollinger Bands (period 20): neutral, declining volatility.
- The main recommendation: sale entry is started from 1.3180 (MA 100 to H4), 1.3200, 1.3240 (MA 200 per H4).
- Alternative recommendation: buy entry is started from 1.3120, 1.3080, 1.3050.
The British pound also remains under pressure of correction, keeping a sideways trend. Also, it is possible to form a double top figure on H1 on this pair.
USD CHF (current price: 0.9980)
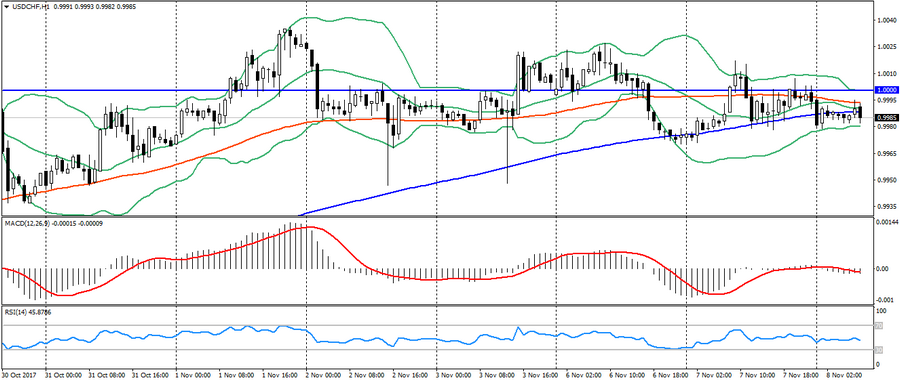
- Support levels: 0.9700, 0.9600, 0.9530.
- Resistance levels: 1.0000, 1.0050, 1.0100 (May maximum).
- Computer analysis: MACD (signal – downward motion): the indicator is below 0, the signal line is in the body of the histogram. RSI is in the neutral zone. Bollinger Bands (period 20): neutral, declining volatility.
- The main recommendation: sale entry is started from 1.0000, 1.0020, 1.0050.
- Alternative recommendation: buy entry is started from 0.9970, 0.9950, 0.9930.
The Swiss franc maintains a sideways trend near significant resistance levels.
USD JPY (current price: 113.80)
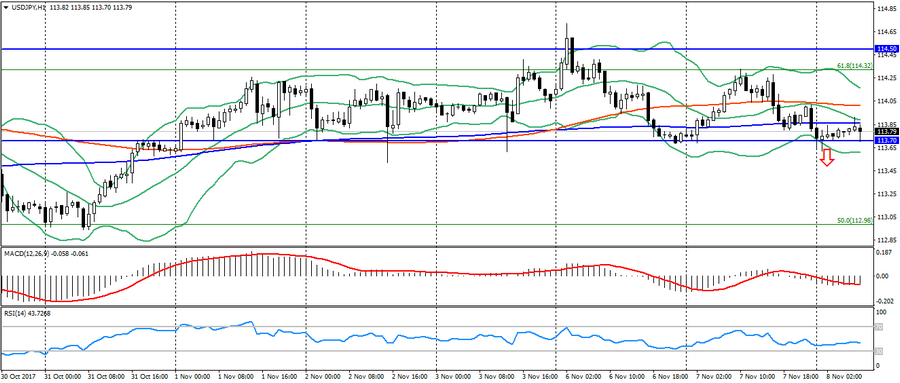
- Support levels: 108.90, 108.10 (April 2017 minimum), 107.30 (2017 minimum).
- Resistance levels: 113.70, 114.50 (July 2017 maximum), 115.00.
- Computer analysis: MACD (signal – downward motion): the indicator is below 0, the signal line is in the body of the histogram. RSI is in the neutral zone. Bollinger Bands (period 20): neutral, declining volatility.
- The main recommendation: sale entry is started from 114.00 (MA 100), 114.30 (Fibo. 61.8 from the maximum of December 2016), 115.00.
- Alternative recommendation: buy entry is started from 113.70, 113.50, 113.30.
The Japanese yen remains near the significant support of 113.70, the breakthrough this level will signal the formation of the figure “head and shoulders” on H4.
USD CAD (current price: 1.2760)
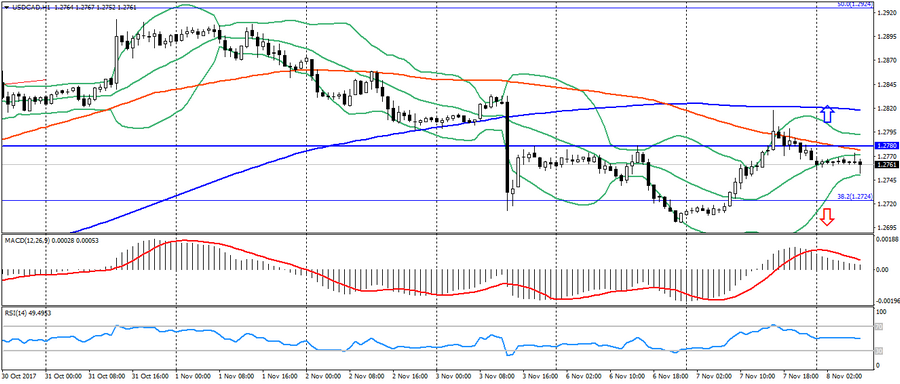
- Support levels: 1.2200, 1.2060 (2017 minimum), 1.1950 (2015 minimum).
- Resistance levels: 1.2780 (August 2017 maximum), 1.3000, 1.3160.
- Computer analysis: MACD (signal – downward motion): the indicator is higher than 0, the signal line has left the body of the histogram. RSI is in the neutral zone. Bollinger Bands (period 20): neutral, low volatility.
- The main recommendation: sale entry is started from 1.2780, 1.2800, 1.2820 (MA 200).
- Alternative recommendation: buy entry is started from 1.2750, 1.2730 (Fibo.38.2 from the May maximum), 1.2700.
The Canadian dollar is trading in a narrow flat, which is caused by the uncertainty of the market and the lack of drivers.
AUD USD (current price: 0.7660)
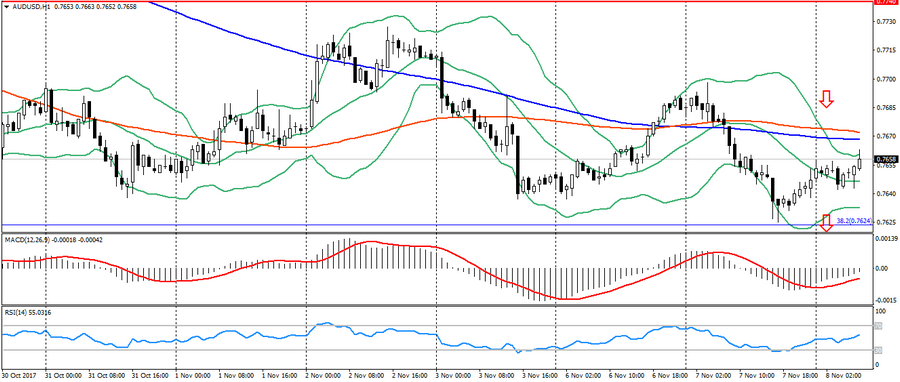
- Support levels: 0.7740, 0.7320 (2017 minimum), 0.7120.
- Resistance levels: 0.8120 (2017 maximum), 0.8200, 0.8290 (2014 maximum).
- Computer analysis: MACD (signal – upward motion): the indicator is below 0, the signal line has left the body of the histogram. RSI is in the neutral zone. Bollinger Bands (period 20): oversold, growing volatility.
- The main recommendation: sale entry is started from 0.7670 (MA 200), 0.7690, 0.7720.
- Alternative recommendation: buy entry is started from 0.7630 (Fibo. 38.2 from the low of January 2016), 0.7600, 0.7570.
The Australian has slightly strengthened at the beginning of the day, but technical factors indicate the preservation of a downtrend.
NZD USD (current price: 0.6910)
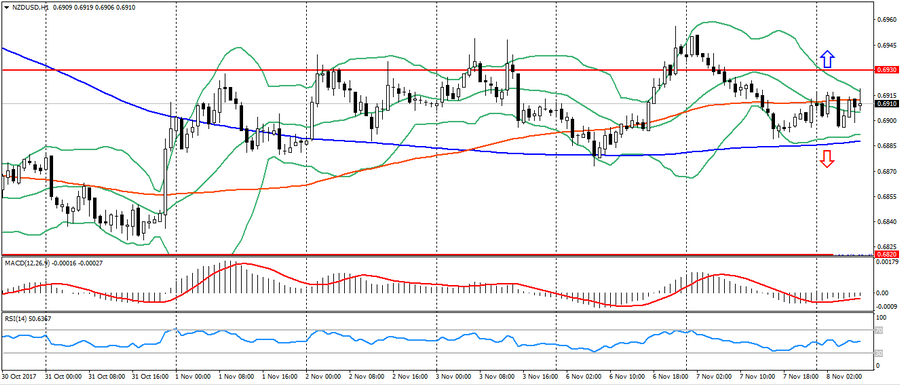
- Support levels: 0.7000, 0.6930, 0.6820 (the minimum of the current year).
- Resistance levels: 0.7380, 0.7450, 0.7550 (2017 maximum).
- Computer analysis: MACD (signal – upward motion): the indicator is below 0, the signal line has left the body of the histogram. RSI is in the neutral zone. Bollinger Bands (period 20): neutral, declining volatility.
- The main recommendation: sale entry is started from 0.6910 (MA 100), 0.6930, 0.6960.
- Alternative recommendation: buy entry is started from 0.6890 (MA 200), 0.6870 (MA 200), 0.6850.
The New Zealand dollar is also trading in flat because of market uncertainty.
XAU USD (current price: 1277.00)
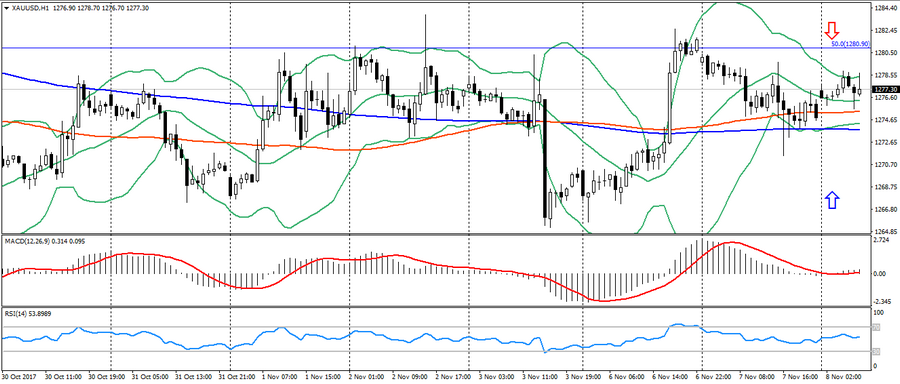
- Support levels: 1250.00, 1226.00, 1200.00.
- Resistance levels: 1340.00, 1355.00, 1374.00 (2016 maximum).
- Computer analysis: MACD (signal – upward motion): the indicator is above 0, the signal line is in the body of the histogram. RSI is in the neutral zone. Bollinger Bands (period 20): neutral, growing volatility.
- The main recommendation: sale entry is started from 1278.00, 1280.00 (Fibo. 50.0 from the July low) (MA200), 1283.00.
- Alternative recommendation: buy entry is started from 1275.00 (MA 100), 1273.00 (MA 200), 1270.00.
Gold slightly strengthened early in the day on the flight of investors from risks, but the overall dynamics of gold remains limited to the lateral trend.