
Тechnical analysis of currency pairs (Anton Hanzenko)
EUR USD (current price: 1.1640)
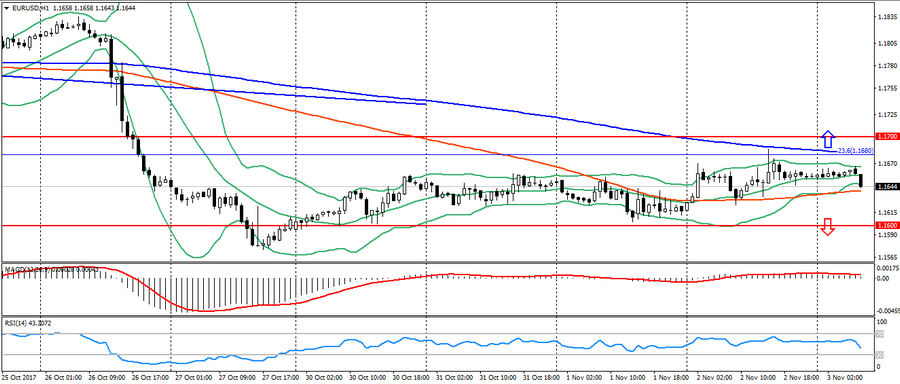
- Support levels: 1.1700 (August 2015 maximum), 1.1600 (2016 maximum), 1.1470.
- Resistance levels: 1.2000, 1.2100, 1.2270 (November 2014 minimum).
- Computer analysis: MACD (signal-flat): the indicator is near 0. RSI is in the neutral zone. Bollinger Bands (period 20): neutral, low volatility.
- The main recommendation: sale entry is started from 1.1680 (Fibo. 23.6 from December 2016), 1.1700 (strong psychology), 1.1740.
- Alternative recommendation: buy entry is started from 1.1640 (MA 100), 1.1600 (strong psychology), 1.1580.
The EUR/USD remains the fourth day in a sideways trend, trading below the key resistance of 1.1680 and above support 1.1600. Because of the continued motion in flat, forecasts for the pair are canceled. In addition, the market comes back to life after the data on employment in the US.
GBP USD (current price: 1.3050)
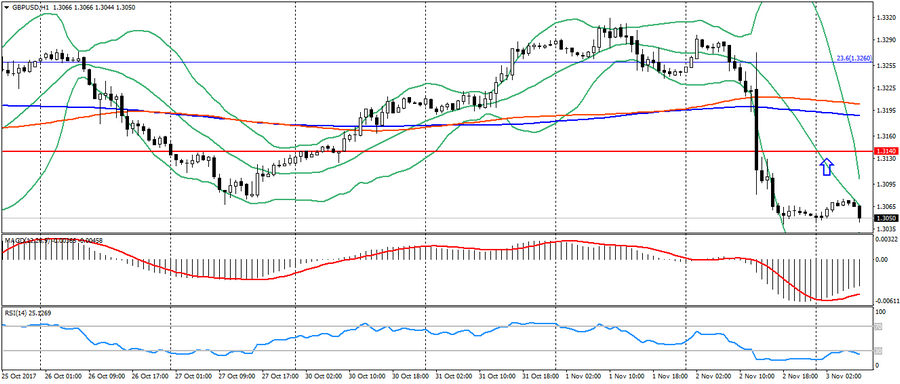
- Support levels: 1.3140, 1.2900, 1.2740 (August 2017 minimum).
- Resistance levels: 1.3500, 1.3660, 1.3830 (February 2016 minimum).
- Computer analysis: MACD (signal – upward motion): the indicator is below 0, the signal line in the body of the histogram. RSI in the oversold zone. Bollinger Bands (period 20): neutral, declining volatility.
- The main recommendation: entry for sale from 1.3100, 1.3140, 1.3190 (MA 200).
- Alternative recommendation: buy-in from 1.3050, 1.3020 (Fibo, 38.1 from the January low), 1.3000.
The British pound remains trading near the low of the month on the results of the meeting of the Bank of England, limiting itself to a significant oversold.
USD CHF (current price: 0.9990)
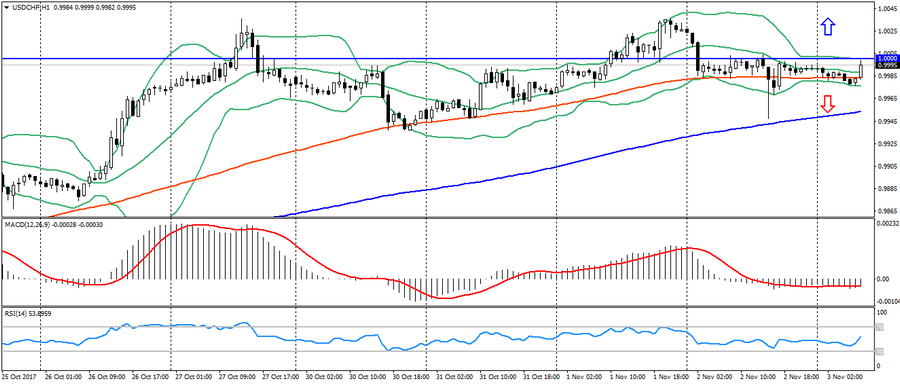
- Support levels: 0.9700, 0.9600, 0.9530.
- Resistance levels: 1.0000, 1.0050, 1.0100 (May maximum).
- Computer analysis: MACD (signal – downward motion): the indicator is below 0, the signal line in the body of the histogram. RSI in the neutral zone. Bollinger Bands (period 20): neutral, low volatility.
- The main recommendation: entrance for sale from 1.0000, 1.0030 (local maximum), 1.0050.
- Alternative recommendation: buy-in from 0.9950 (MA 200), 0.9930, 0.9900.
The Swiss franc slightly strengthened at the beginning of the day on negative sentiments for the American, but the further dynamics of the pair is limited by the upcoming data on the US.
USD JPY (current price: 114.10)
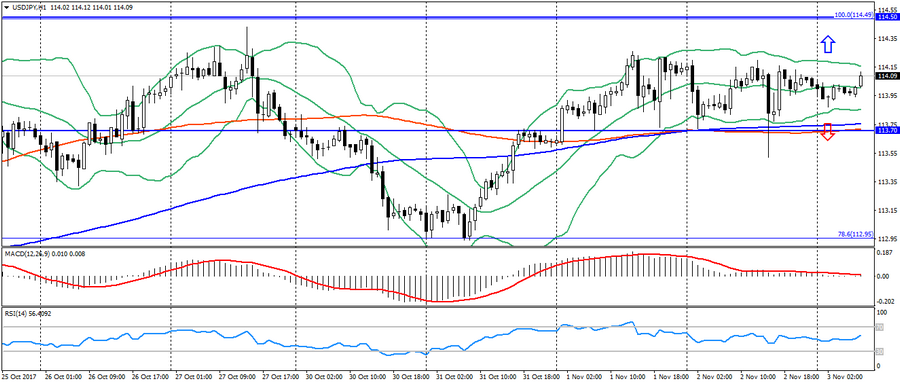
- Support levels: 108.90, 108.10 (minimum April 2017), 107.30 (at least 2017).
- Resistance levels: 113.70, 114.50 (July 2017 high), 115.00.
- Computer analysis: MACD (signal-flat): indicator near 0. RSI in the neutral zone. Bollinger Bands (period 20): neutral, low volatility.
- The main recommendation: entrance for sale from 114.20, 114.50 (July maximum), 114.70.
- Alternative recommendation: purchase entry from 113.70 (MA 200), 113.50, 113.30 (Fibo 78.6 from the July maximum).
The Japanese yen remains to trade in a sideways trend, despite the ambiguity of stock indices and the expectation of news on the US.
USD CAD (current price: 1.2820)
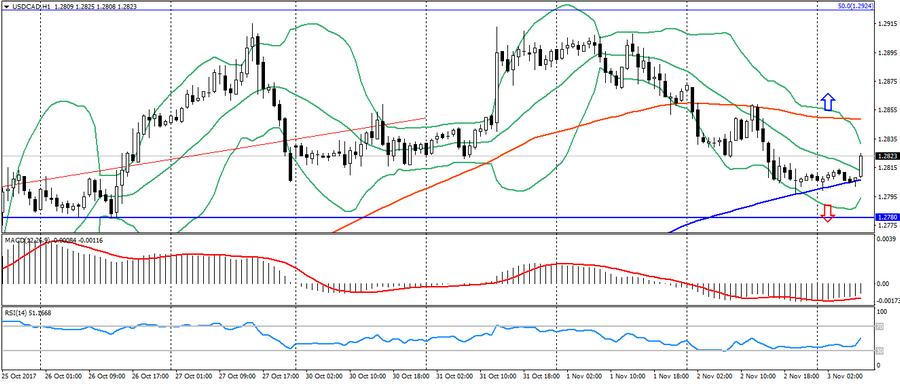
- Support levels: 1.2200, 1.2060 (at least 2017), 1.1950 (at least 2015).
- Resistance levels: 1.2780 (August 2017 high), 1.3000, 1.3160.
- Computer analysis: MACD (signal – upward motion): the indicator is below 0, the signal line has left the body of the histogram. RSI is in the neutral zone. Bollinger Bands (period 20): neutral, declining volatility.
- The main recommendation: sale entry is started from 1.2830, 1.2850 (MA 100), 1.2900.
- Alternative recommendation: buy entry is started from 1.2780, 1.2750, 1.2730 (Fibo. 38.2 from the May maximum).
The Canadian dollar appreciably weakened at the beginning of the day on the correction of positions before the publication of the report on employment in the US. On H4, a double top figure and a bearish divergence formed, which could increase the decline in this pair.
AUD USD (current price: 0.7670)
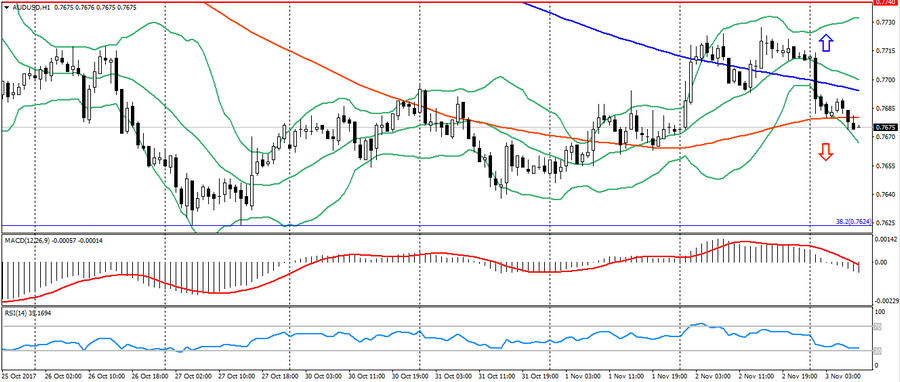
- Support levels: 0.7740, 0.7320 (2017 minimum), 0.7120.
- Resistance levels: 0.8120 (2017 maximum), 0.8200, 0.8290 (2014 maximum).
- Computer analysis: MACD (signal – downward motion): the indicator is below 0, the signal line is in the body of the histogram. RSI is in the oversold zone. Bollinger Bands (period 20): oversold, growing volatility.
- The main recommendation: sale entry is started from 0.7690 (MA 200), 0.7720, 0.7740.
- Alternative recommendation: buy entry is started from of 0.7660, 0.7640, 0.7620 (Fibo. 38.2 from the low of January 2016).
The Australian remains under pressure of flat data and correction of positions relative to the American. But the further dynamics of the pair, like the rest, remains limited due to the expectation of data on the US.
NZD USD (current price: 0.6920)
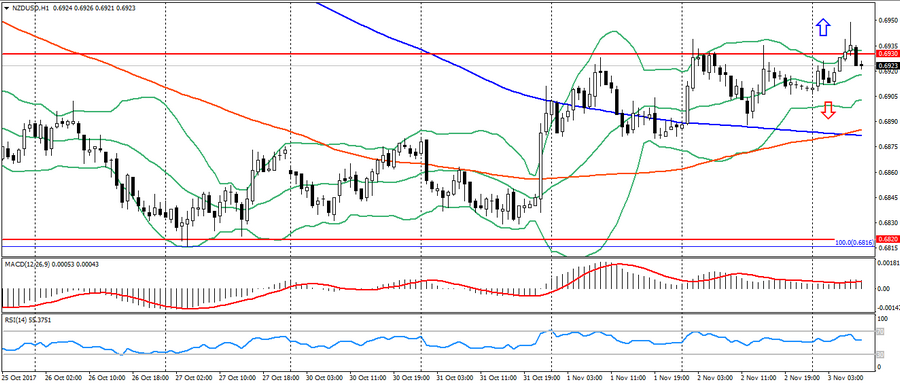
- Support levels: 0.7000, 0.6930, 0.6820 (the minimum of the current year).
- Resistance levels: 0.7380, 0.7450, 0.7550 (2017 maximum).
- Computer analysis: MACD (signal – upward motion): the indicator is above 0, the signal line is in the body of the histogram. RSI is in the neutral zone. Bollinger Bands (period 20): neutral, declining volatility.
- The main recommendation: sale entry is started from 0.6950, 0.6980 (Fibo. 78.6 from the April’s low), 0.7000.
- Alternative recommendation: buy entry is started from 0.6910, 0.6890 (MA 200), 0.6860 (MA 100).
The New Zealand dollar is trading with a small strengthening, but is also limited by upcoming US data
XAU USD (current price: 1275.00)
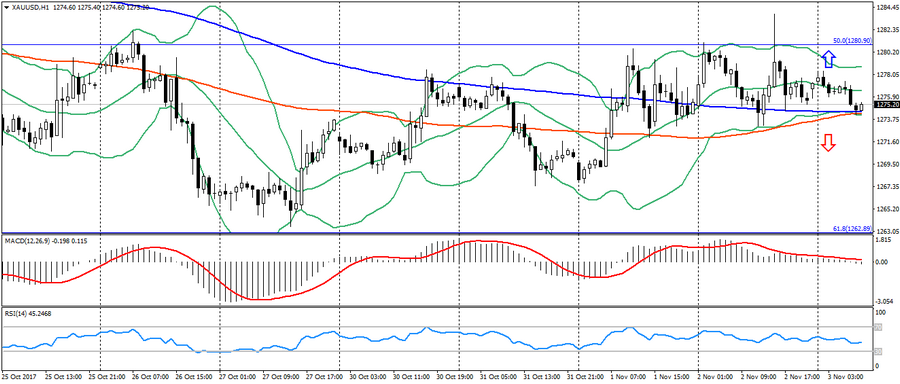
- Support levels: 1250.00, 1226.00, 1200.00.
- Resistance levels: 1340.00, 1355.00, 1374.00 (2016 maximum).
- Computer analysis: MACD (signal – downward motion): the indicator is higher than 0, the signal line has left the body of the histogram. RSI is in the neutral zone. Bollinger Bands (period 20): neutral, declining volatility.
- The main recommendation: sale entry is started from 1279.00, 1281.00 (Fibo. 50.0 from the low of July), 1283.00.
- Alternative recommendation: buy entry is started from 1274.00 (MA 200), 1272.00 (MA 100), 1268.00.
Gold remains under pressure of technology (divergence), but is also limited to low activity ahead of the US data.