
Technical Analysis of Oil (Alexander Sivtsov)
Oil is declining during the Asian session.
The Brent graph (current price: $ 6831.40 per 100 barrels)
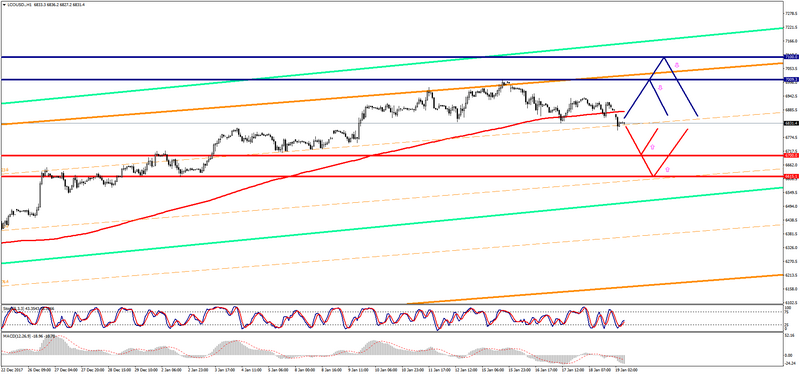
The Brent brand is traded below the zero mark during the Asian session.
- Resistance 1: From $ 7009.30 (January 15 maximum)
- Resistance 2: From $ 7100.00 (psychological level)
- Support 1: From $ 6700.00 (psychological level)
- Support 2: From $ 6615.10 (January 2 minimum)
Computer analysis: The Stochastic Oscillator movings on the H4 chart enter the oversold zone. So, the Brent price may recover in the second half of Friday trades.
The WTI graph (current price: $ 6304.30 per 100 barrels)
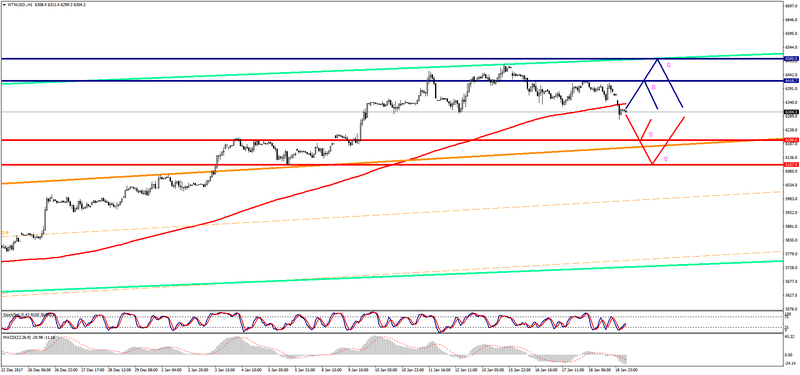
The WTI brand is traded with a minus during the Asian session.
- Resistance 1: From $ 6418.70 (January 18 maximum)
- Resistance 2: From $ 6500.00 (psychological level)
- Support 1: From $ 6200.00 (psychological level)
- Support 2: From $ 6107.90 (January 5 minimum)
Computer analysis: The Stochastic Oscillator movings on the H4 chart are in the oversold zone, which is why the WTI price growth may be resumed.