
Технический анализ нефти (Александр Сивцов)
Нефть торгуется вблизи нулевых отметок в ходе Азиатской сессии.
График марки Brent (текущая цена: $6717.70 за 100 баррелей)
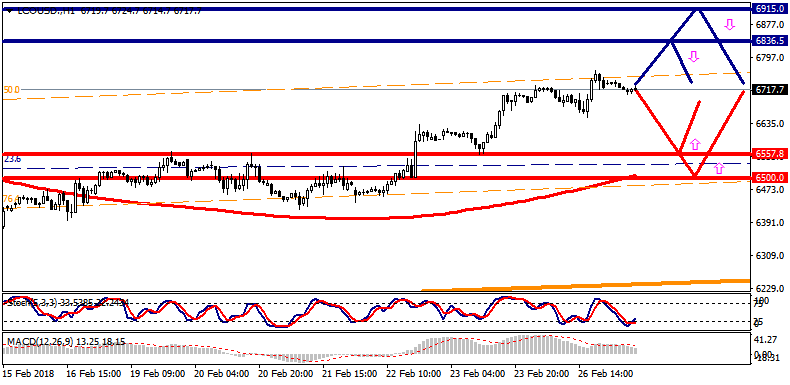
Марка Brent торгуется с небольшим минусом в ходе Азиатской сессии.
- Сопротивление 1: С$6836.50 (максимум 5 февраля)
- Сопротивление 2: С$6915.00 (технический уровень)
- Поддержка 1: С$6557.80 (минимум 23 февраля)
- Поддержка 2: С$6500.00 (психологический уровень)
Компьютерный анализ: По индикатору форекс MACD на графике Н1 сохраняется “Медвежья дивергенция”, на фоне чего возможно некоторое снижение цены марки Brent.
График марки WTI (текущая цена: $6373.50 за 100 баррелей)
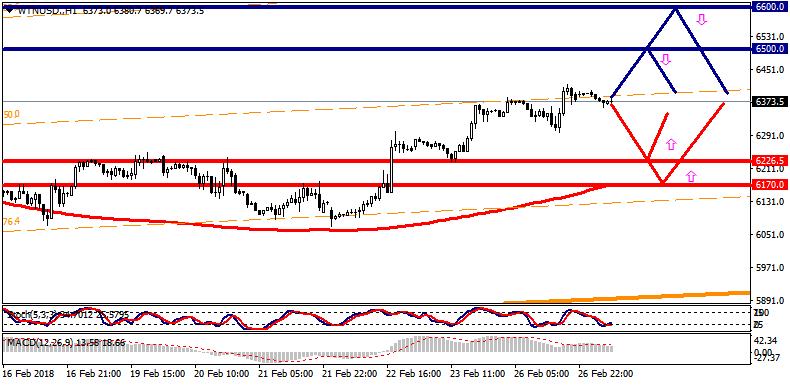
Марка WTI ведет торги вблизи нулевой отметки в ходе Азиатской сессии.
- Сопротивление 1: С$6500.00 (психологический уровень)
- Сопротивление 2: С$6600.00 (психологический уровень)
- Поддержка 1: С$6226.50 (минимум 23 февраля)
- Поддержка 2: С$6170.00 (МА 200 на Н1)
Компьютерный анализ: По индикатору форекс MACD на графике Н1 продолжает формироваться “Медвежья дивергенция”, в связи с чем стоит ожидать понижательной коррекции цены WTI.