
Технічний аналіз золота і срібла (Олександр Сівцов)
Графік Золота (поточна ціна: $ 1342.90)
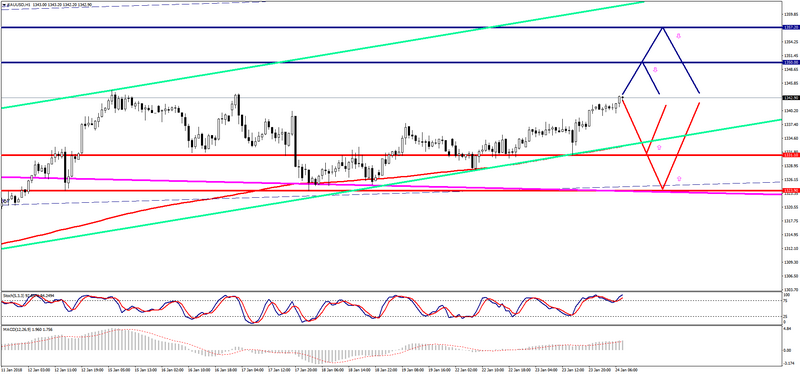
Золото торгується вище нульової позначки в ході Азіатської сесії.
- Опір 1: С $ 1350.00 (технічний рівень)
- Опір 2: З $ 1357.20 (максимум 8 вересня)
- Підтримка 1: С $ 1331.10 (мінімум 23 січня)
- Підтримка 2: З $ 1323.90 (мінімум 18 січня)
Комп’ютерний аналіз: мувiнги Stochastic Oscillator на графіку Н4 вказують на перекупленнiсть інструменту, на тлі чого варто очікувати низхiдної корекції ціни на золото.
Графік Срібла (поточна ціна: $ 17.02)
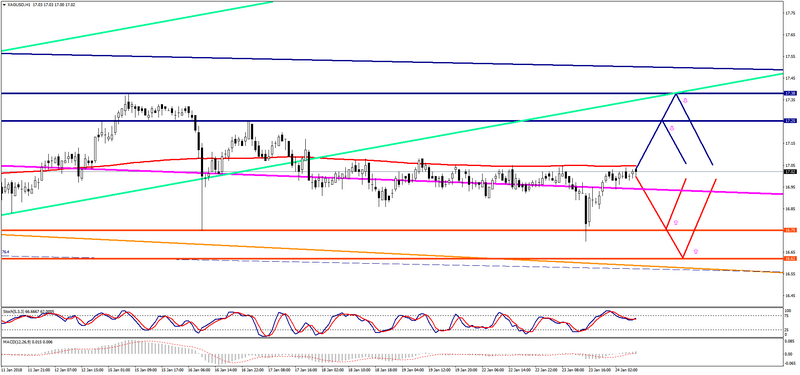
Срібло торгується з плюсом в ході Азіатської сесії.
- Опір 1: С $ 17.25 (максимум 17 січня)
- Опір 2: З $ 17.38 (максимум 15 січня)
- Підтримка 1: С $ 16.75 (мінімум 16 січня)
- Підтримка 2: З $ 16.62 (технічний рівень)
Комп’ютерний аналіз: мувiнги Stochastic Oscillator на графіку Н4 вказують на перекупленнiсть інструменту, в зв’язку з чим можливе зниження ціни срібла.