
Технический анализ золота и серебра (Александр Сивцов)
График Золота (текущая цена: $1329.40)
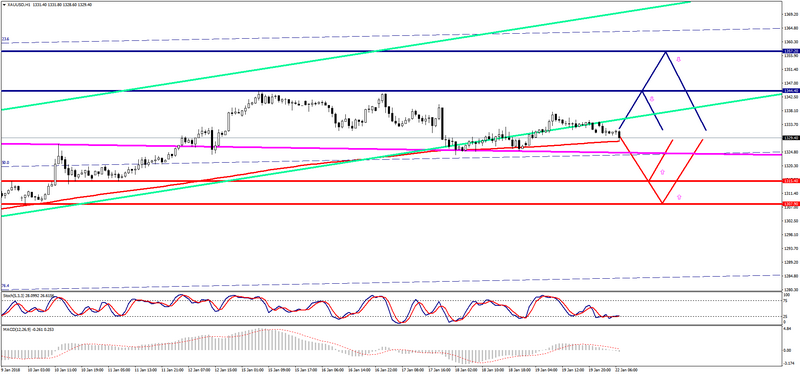
Золото торгуется ниже нулевой отметки в ходе Азиатской сессии.
- Сопротивление 1: С$1344.40 (максимум 15 января)
- Сопротивление 2: С$1357.20 (максимум 8 сентября)
- Поддержка 1: С$1315.40 (минимум 11 января)
- Поддержка 2: С$1307.90 (минимум 10 января)
Компьютерный анализ: Мувинги Stochastic Oscilliator на графике Н4 входят в зону перепроданности, на фоне чего стоит ожидать восстановления цены на золото во второй половине торгов понедельника.
График Серебра (текущая цена: $16.93)
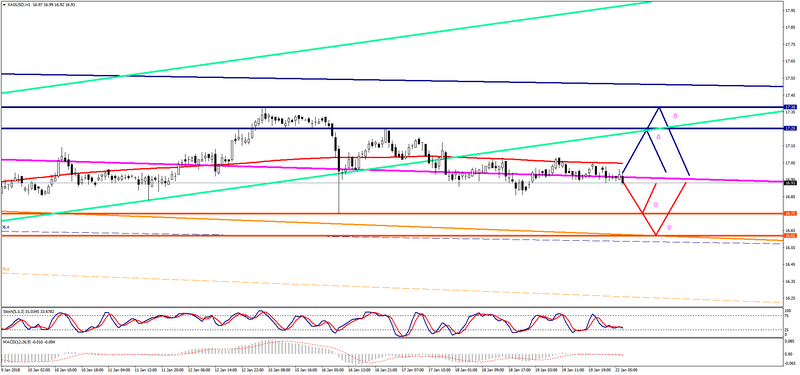
Серебро торгуется с минусом в ходе Азиатской сессии.
- Сопротивление 1: С$17.25 (максимум 17 января)
- Сопротивление 2: С$17.38 (максимум 15 января)
- Поддержка 1: С$16.75 (минимум 16 января)
- Поддержка 2: С$16.62 (технический уровень)
Компьютерный анализ: По серебру мувинги Stochastic Oscilliator на графике Н4 входят в зону перепроданности, в связи с чем возможно возобновление роста цены серебра во второй половине торгов понедельника.