
Технічний аналіз нафти (Олександр Сівцов)
Нафта знижується в ході Азіатської сесії.
Графік марки Brent (поточна ціна: $ 6812.80 за 100 барелів)
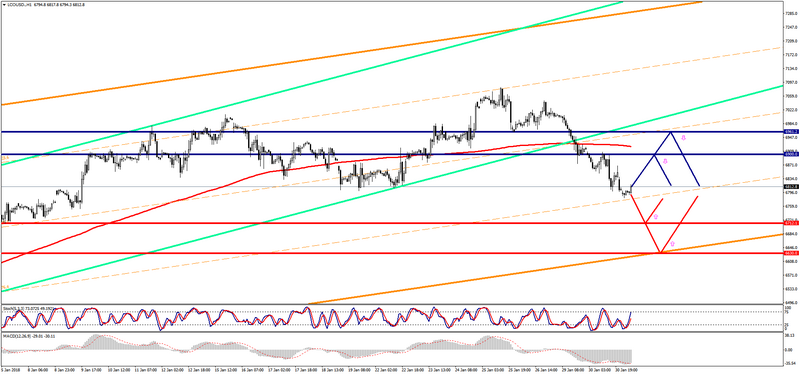
Марка Brent торгується з мінусом в ході Азіатської сесії.
- Опір 1: С $ 6900.00 (психологічний рівень)
- Опір 2: З $ 6961.20 (мінімум 25 січня)
- Підтримка 1: С $ 6712.10 (мінімум 5 січня)
- Підтримка 2: З $ 6630.00 (технічний рівень)
Комп’ютерний аналіз: мувінги Stochastic Oscillator на графіку Н1 знаходяться в нейтральній зоні, на тлі чого можлива консолідація ціни марки Brent в ході Європейської сесії.
Графік марки WTI (поточна ціна: $ 6398.40 за 100 барелів)
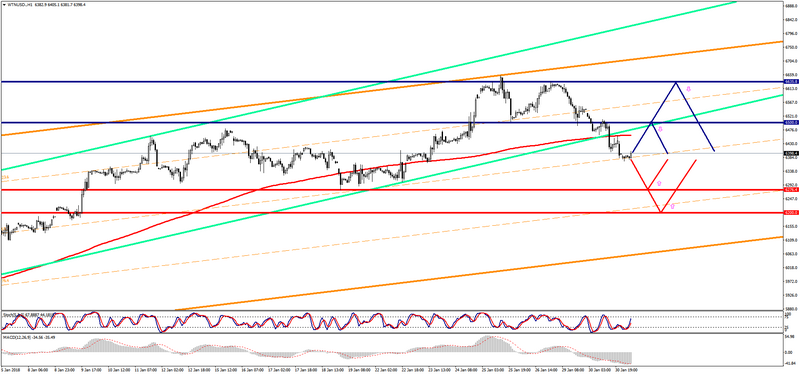
Марка WTI веде торги нижче нульової позначки в ході Азіатської сесії.
- Опір 1: С $ 6500.00 (психологічний рівень)
- Опір 2: З $ 6635.80 (максимум 29 січня)
- Підтримка 1: С $ 6276.40 (мінімум 19 січня)
- Підтримка 2: З $ 6200.00 (психологічний рівень)
Комп’ютерний аналіз: мувінги Stochastic Oscillator на графіку Н1 знаходяться в нейтральній зоні, в зв’язку з чим варто очікувати формування консолідації ціни WTI.