Технічний аналіз золота і срібла (Андре Грін)
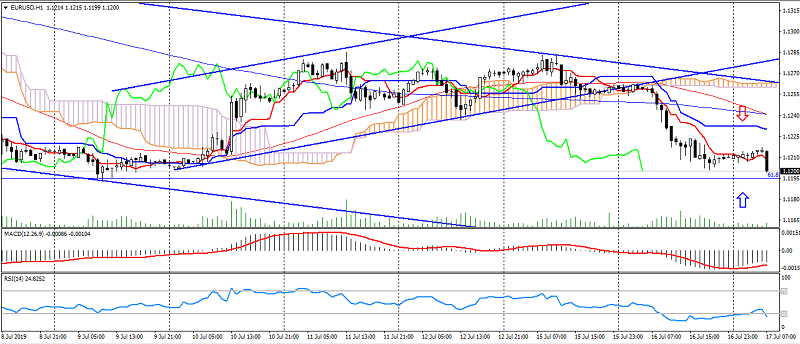
Індикатори Forex використовуються в Технічному аналізі: MACD, RSI, Ichimoku Kinko Hyo, рівновіддалений канал, Лінії Фібоначчі, Цінові Рівні.
Заробляйте за допомогою сервісу торгівлі на новинах Erste News!
Графік Золота (поточна ціна: $ 1421.00)
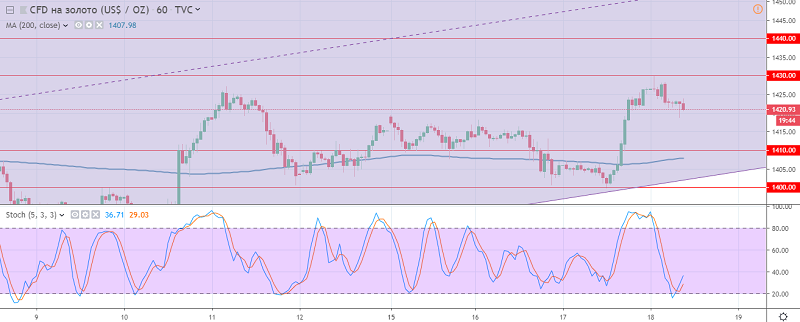
Золото повернулося до зростання після зниження на загостренні ризиків, ніж відновило висхідну динаміку.