Технический анализ золота и серебра (Александр Сивцов)
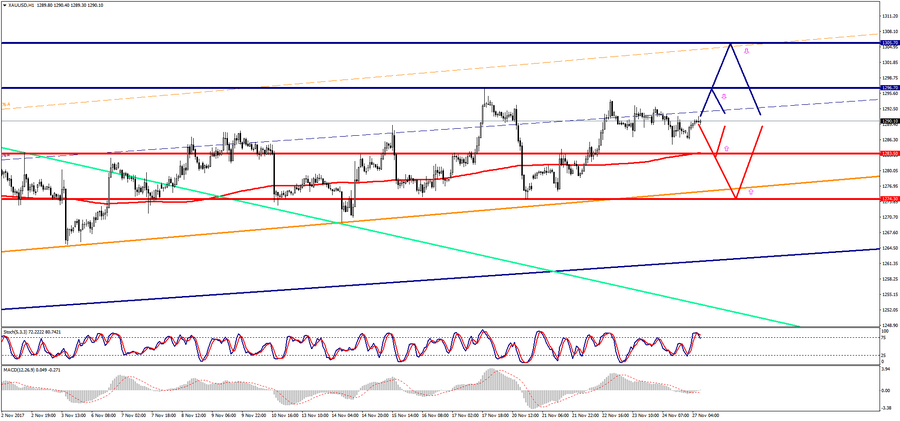
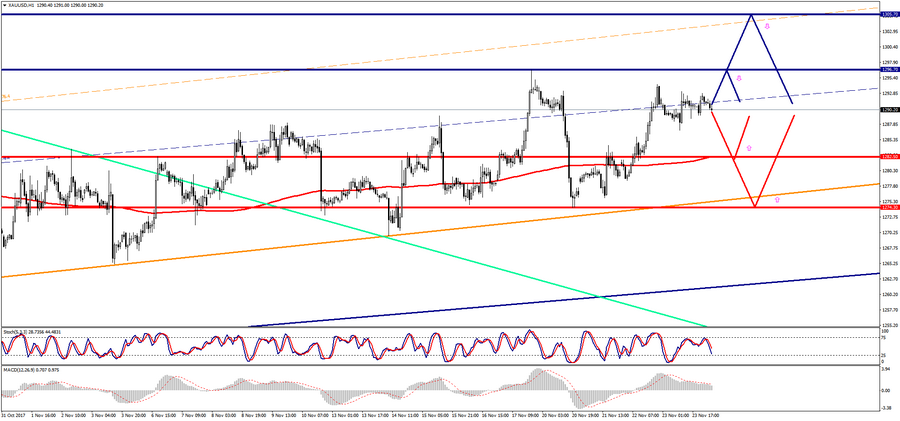
График Золота (текущая цена: $1292.70)
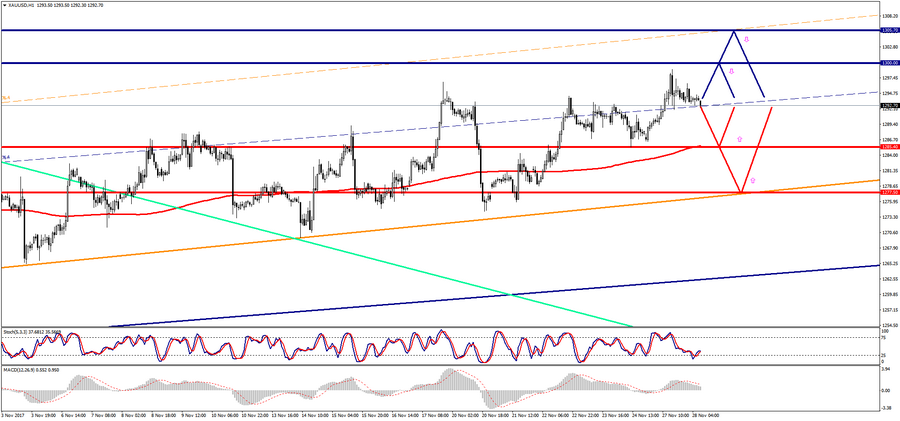
Золото торгуется ниже нулевой отметки в ходе Азиатской сессии.
Золото торгуется ниже нулевой отметки в ходе Азиатской сессии.
Нефть демонстрирует смешанную динамику в ходе Азиатской сессии.
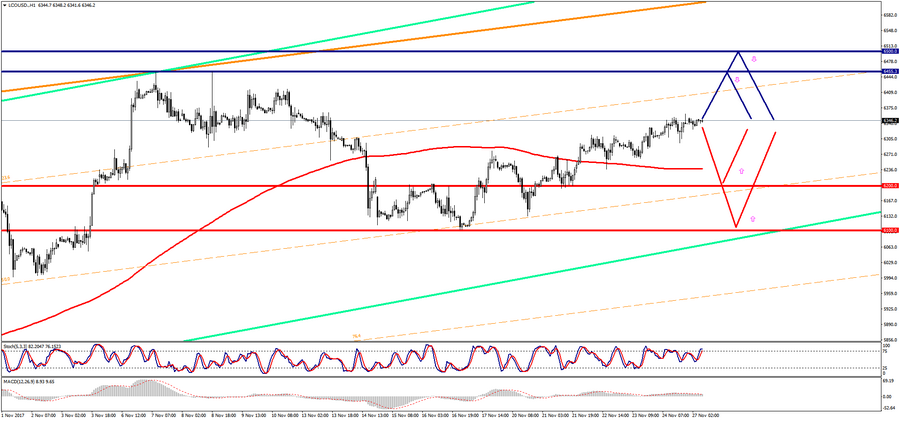
Марка Brent торгуется выше нулевой отметки в ходе Азиатской сессии.
Золото торгуется выше нулевой отметки в ходе Азиатской сессии.
Нефть демонстрирует смешанную динамику в ходе Азиатской сессии.
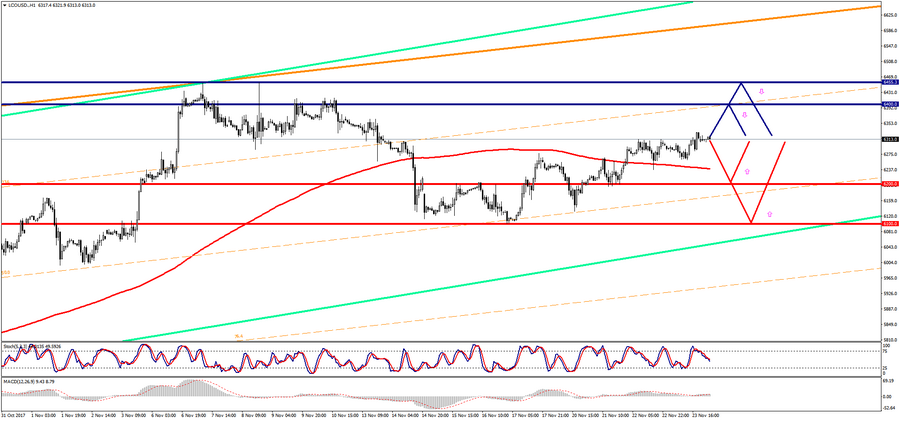
Марка Brent торгуется ниже нулевой отметки в ходе Азиатской сессии.
Золото торгуется ниже нулевой отметки в ходе Азиатской сессии.