Technical analysis

Technical analys of oil (Anton Hanzenko)

Oil was under pressure of correction after the renewal of the three-year maximum.

Brent chart (current price: $ 77.30)


The Brent is trading slightly lower than yesterday’s high, adjusting after growth and retaining the potential for growth.

Technical analys of gold and silver (Anton Hanzenko)

Gold chart (current price: $ 1313.00)


Gold keeps lateral dynamics on the uncertainty of the market.

Technical analys of oil (Anton Hanzenko)

Oil maintains an upward trend due to the reduction of oil reserves and the anticipation of sanctions against Iran.

Brent chart (current price: $ 77.70)


The Brent has updated the maximum of recent years in anticipation of sanctions against Iran.

Technical analysis of cross-rates. (Anton Hanzenko)

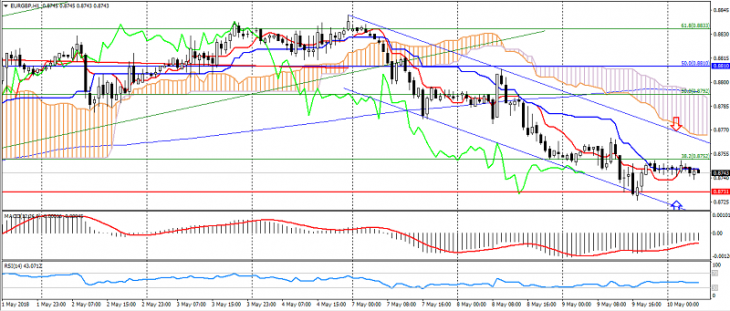
EUR GBP (current price: 0.8740)

  • Support levels: 0.8730 (minimum of the last months), 0.8650, 0.8530.
  • Resistance levels: 0.8810, 0.8900, 0.9050 (November 2016 maximum).
  • Computer analysis: MACD (12, 26, 9) (signal – upward movement): the indicator is below 0, the signal line has left the body of the histogram. RSI (14) is in the neutral zone. Ichimoku Kinko Hyo (9, 26, 52) (signal – downward movement): the Tenkan-sen line is below the Kijun-sen line, the price is below the cloud.

Тechnical analysis of currency pairs (Anton Hanzenko)

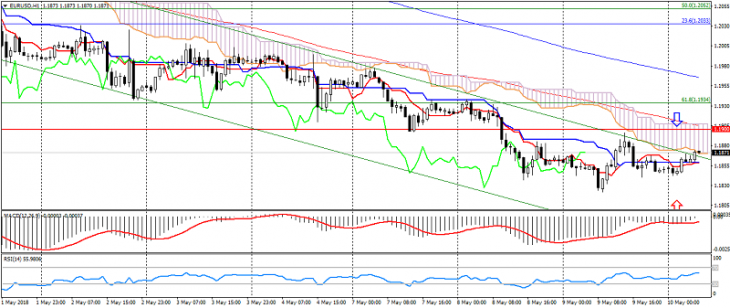
EUR USD (current price: 1.1870)

  • Support levels: 1.2100 (September-September maximum), 1.1900, 1.1700.
  • Resistance levels: 1.2600, 1.2750 (March 2013 minimum), 1.2270 (November 2014 minimum).
  • Computer analysis: MACD (12, 26, 9) (signal – upward movement): indicator above 0, signal line in the body of the histogram. RSI (14) in the neutral zone. Ichimoku Kinko Hyo (9, 26, 52) (signal – downward movement): the Tenkan-sen line is below the Kijun-sen line, the price is below the cloud.

Technical analys of gold and silver (Anton Hanzenko)

Gold chart (current price: $ 1309.00)


Gold resumed a decline due to the reduction of risks, while limiting itself to a restrained upward trend.

Technical analys of oil (Anton Hanzenko)

Oil returns to annual highs on the waiting for new sanctions against Iran.

The Brent chart (current price: $ 76.60)


The Brent has updated the maximum of recent years on the waiting for sanctions against Iran.

Technical analysis of cross-rates. (Anton Hanzenko)

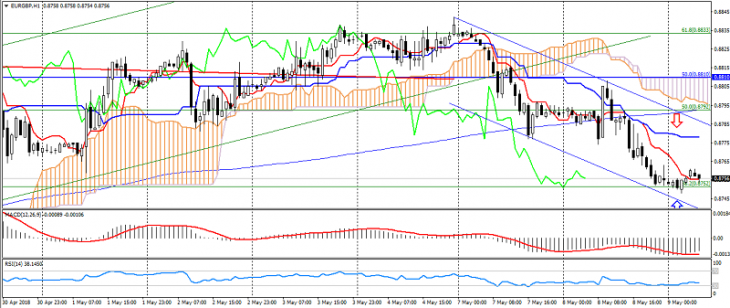
EUR GBP (current price: 0.8750)

  • Support levels: 0.8730 (minimum of the last months), 0.8650, 0.8530.
  • Resistance levels: 0.8810, 0.8900, 0.9050 (November 2016 maximum).
  • Computer analysis: MACD (12, 26, 9) (signal – upward movement): the indicator is below 0, the signal line has left the body of the histogram. RSI (14) is in the zone of easy overselling. Ichimoku Kinko Hyo (9, 26, 52) (signal – downward movement): the Tenkan-sen line is below the Kijun-sen line, the price is below the cloud.

Тechnical analysis of currency pairs (Anton Hanzenko)

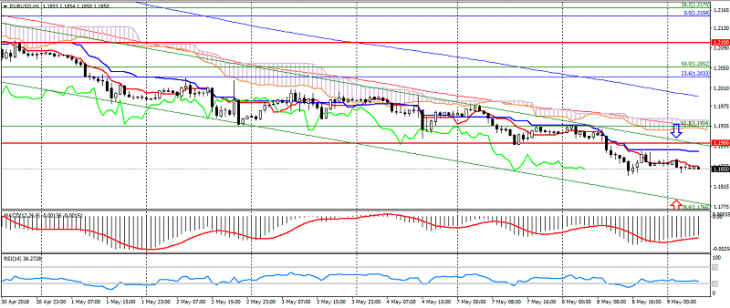
EUR USD (current price: 1.1850)

  • Support levels: 1.2100 (September 2017 maximum), 1.1900, 1.1700.
  • Resistance levels: 1.2600, 1.2750 (March 2013 minimum), 1.2270 (November 2014 minimum).
  • Computer analysis: MACD (12, 26, 9) (signal – upward movement): the indicator is below 0, the signal line has left the body of the histogram. RSI (14) is in the oversold zone. Ichimoku Kinko Hyo (9, 26, 52) (signal – downward movement): the Tenkan-sen line is below the Kijun-sen line, the price is below the cloud.