Технічний аналіз валютних пар (Антон Ганзенко)
Індикатори Forex використовуються в Технічному аналізі: MACD, RSI, Ichimoku Kinko Hyo, рівновіддалений канал, Лінії Фібоначчі, Цінові Рівні.
Заробляйте за допомогою сервісу торгівлі на новинах Erste News!
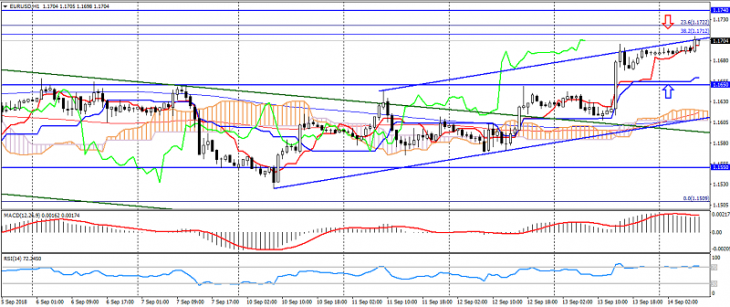
EUR USD (поточна ціна: 1.1720)
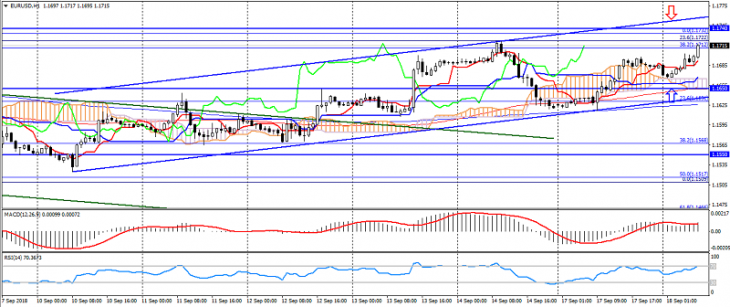
- Рівні підтримки: 1.1450, 1.1350, 1.1200.
- Рівні опору: 1.1550, 1.1650, 1.1740.
- Комп’ютерний аналіз: MACD (12, 26, 9) (сигнал – висхідний рух): індикатор вище 0, сигнальна лінія в тілі гістограми. RSI (14) в зоні перекупленості. Ichimoku Kinko Hyo (9, 26, 52) (сигнал – висхідний рух): лінія Tenkan-sen вище лінії Kijun-sen, ціна вище хмари.