Технический анализ валютных пар (Антон Ганзенко)
Индикаторы Forex использующиеся в Техническом анализе: MACD, RSI, Ichimoku Kinko Hyo, Равноудалённый канал, Линии Фибоначчи, Ценовые Уровни.
Зарабатывайте с помощью сервиса торговли на новостях Erste News!
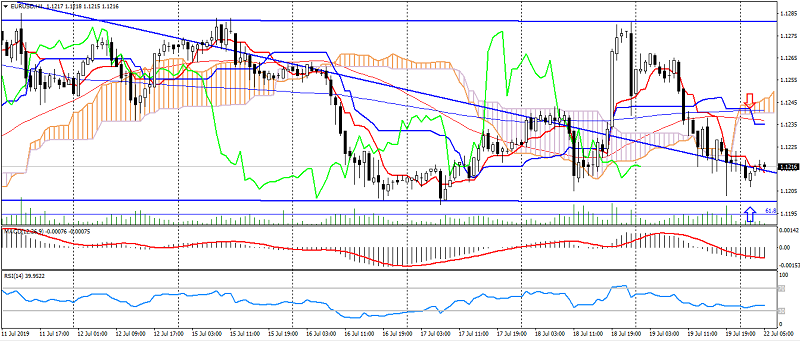
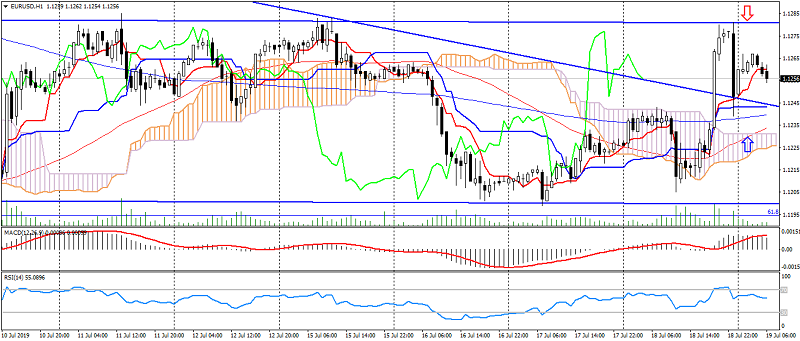
EUR USD (текущая цена: 1.1190)
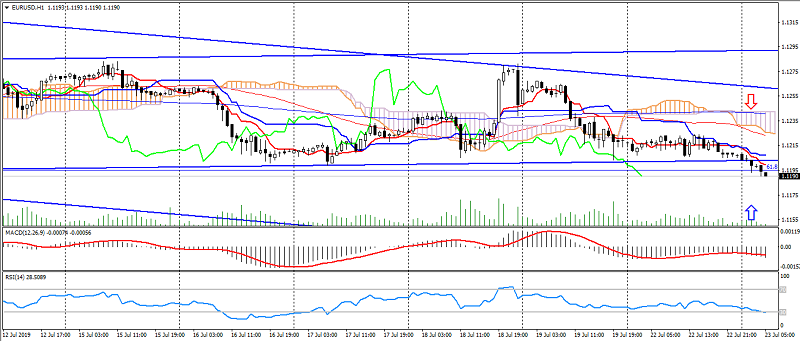
- Уровни поддержки: 1.1350, 1.1200, 1.1100.
- Уровни сопротивления: 1.1450, 1.1550, 1.1650.
- Компьютерный анализ: MACD (12, 26, 9) (сигнал – нисходящее движение): индикатор ниже 0, сигнальная линия в теле гистограммы. RSI (14) в зоне перепроданности. Ichimoku Kinko Hyo (9, 26, 52) (сигнал – нисходящее движение): линия Tenkan-sen ниже Kijun-sen, цена ниже облака.