Тechnical analysis of currency pairs (Anton Hanzenko)
Forex indicators used in Technical analysis: MACD, RSI, Ichimoku Kinko Hyo, Equal-channel, Fibonacci lines, Price Levels.
Earn with the help of the trade service on the news Erste News!
EUR USD (current price: 1.1450)
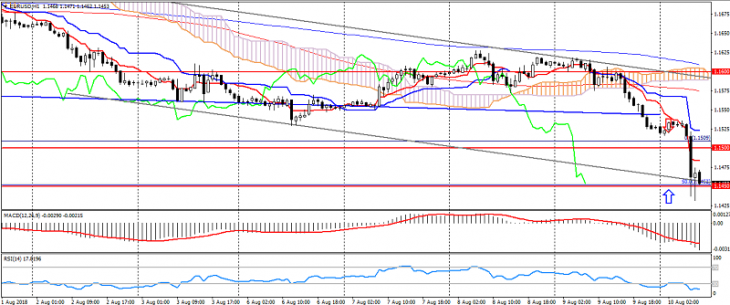
- Support levels: 1.1600 (significant psychology), 1.1500 (local minimum), 1.1450.
- Resistance levels: 1.1750, 1.1850 (June maximum), 1.2000 (May maximum).
- Computer analysis: MACD (12, 26, 9) (signal – downward movement): the indicator is below 0, the signal line in the body of the histogram. RSI (14) in the oversold zone. Ichimoku Kinko Hyo (9, 26, 52) (signal – downward movement): the Tenkan-sen line is below the Kijun-sen line, the price is below the cloud.
- The main recommendation: entrance for sale from 1.1500, 1.1530, 1.1550.
- Alternative recommendation: entry to buy from 1.1450, 1.1420, 1.1400.
The euro-dollar pair accelerated the decline in the growth of risks in the euro area.
GBP USD (current price: 1.2780)
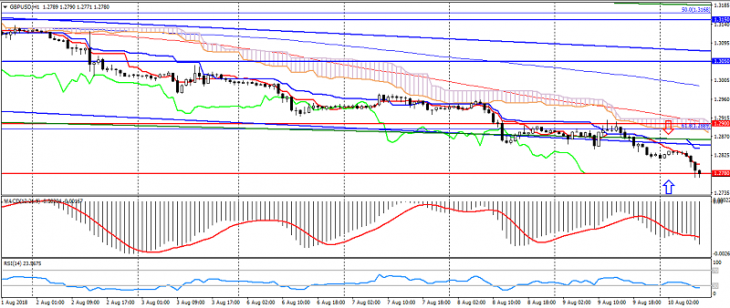
- Support levels: 1.2900 (psychological level), 1.2780, 1.2600 (the minimum of June 2017).
- Resistance levels: 1.3050, 1.3150, 1.3350 (June maximum).
- Computer analysis: MACD (12, 26, 9) (signal – downward movement): the indicator is below 0, the signal line in the body of the histogram. RSI (14) in the oversold zone. Ichimoku Kinko Hyo (9, 26, 52) (signal – downward movement): the Tenkan-sen line is below the Kijun-sen line, the price is below the cloud.
- The main recommendation: entrance for sale from 1.2820, 1.2850, 1.2880.
- Alternative recommendation: the entrance to the purchase from 1.2780, 1.2750, 1.2730.
The British pound also accelerated the decline on the growth of the dollar, provoked by the overall decline in the euro.
USD CHF (current price: 0.9960)
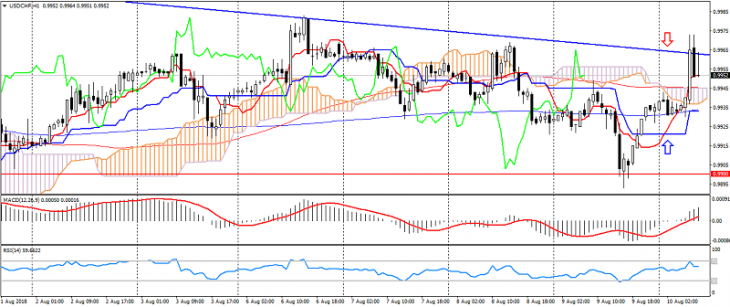
- Support levels: 0.9900, 0.9850 (local minimum), 0.9700 (minimum of June).
- Resistance levels: 1.000 (significant psychology), 1.0050 (May maximum), 1.0100.
- Computer analysis: MACD (12, 26, 9) (signal – upward movement): indicator above 0, signal line in the body of the histogram. RSI (14) in the neutral zone. Ichimoku Kinko Hyo (9, 26, 52) (signal – upward movement): the Tenkan-sen line above the Kijun-sen line, the price is higher than the cloud.
- The main recommendation: entrance for sale from 0.9980, 1.0000, 1.0020.
- Alternative recommendation: buy-in from 0.9950, 0.9920, 0.9900.
The Swiss franc is traded with a strengthening, but is limited by the upper limit of the downward channel.
USD JPY (current price: 110.80)
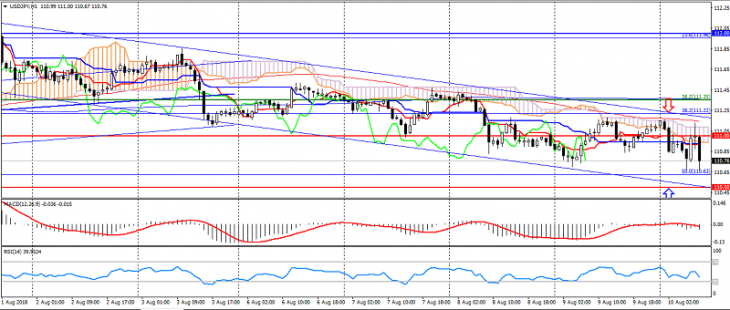
- Support levels: 111.00, 110.50, 109.80.
- Resistance levels: 112.00, 113.30 (maximum of January), 114.00.
- Computer analysis: MACD (12, 26, 9) (signal – downward motion): the indicator is above 0, the signal line in the body of the histogram. RSI (14) in the neutral zone. Ichimoku Kinko Hyo (9, 26, 52) (signal – downward movement): the Tenkan-sen line is below the Kijun-sen line, the price is below the cloud.
- The main recommendation: entrance for sale from 111.00, 111.30 111.50.
- Alternative recommendation: entry to buy from 110.70, 110.50, 110.30.
The US dollar the Japanese yen maintains a downward trend in maintaining risks, despite the strengthening of the American dollar.
USD CAD (current price: 1.3080)
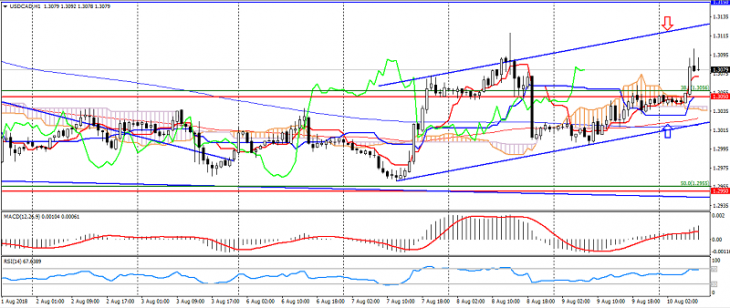
- Support levels: 1.3050 (May high), 1.2950, 1.2850.
- Resistance levels: 1.3150, 1.3250, 1.3380.
- Computer analysis: MACD (12, 26, 9) (signal – upward movement): indicator above 0, signal line in the body of the histogram. RSI (14) in the overbought zone. Ichimoku Kinko Hyo (9, 26, 52) (signal – upward movement): the Tenkan-sen line above the Kijun-sen line, the price is higher than the cloud.
- The main recommendation: entrance for sale from 1.31000, 1.3120, 1.3140.
- Alternative recommendation: buy-in from 1.3070, 1.3050, 1.3020.
The US dollar the Canadian dollar shifted to an upward trend in oil decline and the growth of the US dollar.
AUD USD (current price: 0.7320)
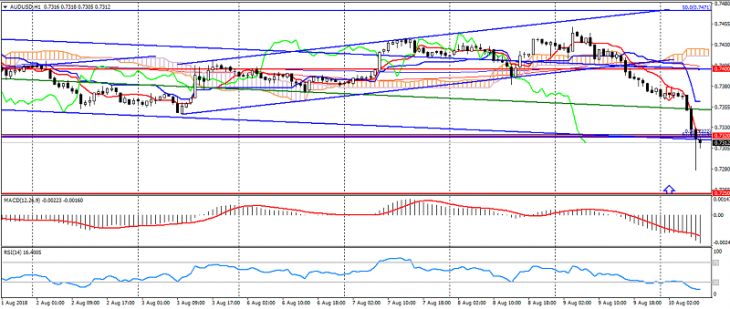
- Support levels: 0.7400, 0.7320, 0.7250.
- Resistance levels: 0.7500, 0.7550, 0.7600.
- Computer analysis: MACD (12, 26, 9) (signal – downward movement): the indicator is below 0, the signal line in the body of the histogram. RSI (14) in the oversold zone. Ichimoku Kinko Hyo (9, 26, 52) (signal – downward movement): the Tenkan-sen line is below the Kijun-sen line, the price is below the cloud.
- The main recommendation: entrance for sale from 0.7350, 0.7380, 0.7400.
- Alternative recommendation: buy-in from 0.7280, 0.7250, 0.7230.
The Australian dollar has also weakened on the growth of risks and publication of the RBA protocol.
NZD USD (current price: 0.6670)
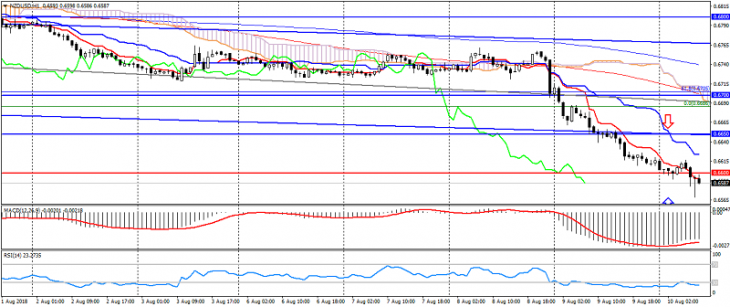
- Support levels: 0.6600, 0.6550, 0.6500.
- Resistance levels: 0.6650, 0.6700, 0.6800.
- Computer analysis: MACD (12, 26, 9) (signal – upward movement): the indicator is below 0, the signal line has left the body of the histogram. RSI (14) in the oversold zone. Ichimoku Kinko Hyo (9, 26, 52) (signal – downward movement): the Tenkan-sen line is below the Kijun-sen line, the price is below the cloud.
- The main recommendation: entry for sale from 0.6640, 0.6660, 0.6680.
- Alternative recommendation: buy-in from 0.6550, 0.6530, 0.6500.
The New Zealand dollar accelerated decline on the growth of the American dollar, limited to oversold
XAU USD (current price: 1207.00)
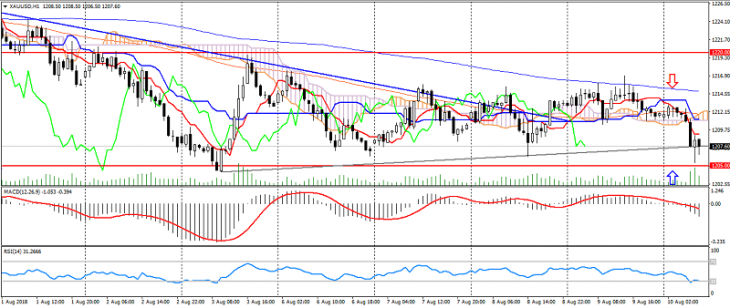
- Support levels: 1220.00, 1205.00, 1193.00.
- Resistance levels: 1240.00, 1250.00, 1265.00.
- Computer analysis: MACD (12, 26, 9) (signal – downward movement): the indicator is below 0, the signal line in the body of the histogram. RSI (14) in the oversold zone. Ichimoku Kinko Hyo (9, 26, 52) (signal – downward movement): the Tenkan-sen line is below the Kijun-sen line, the price is below the cloud.
- The main recommendation: entrance for sale from 1210.00, 1213.00, 1216.00.
- Alternative recommendation: the entrance to the purchase from 1205.00, 1200.00, 1190.00.
Gold has slowed growth on the strengthening of the dollar, but so far it maintains an upward dynamics.