
Construction data in the USA
- Building permits (December), fact 1,326M, forecast 1,290M.
- Building permits (m/m) (December), fact of 0.3%, forecast -2.8%.
- New housing starts (December), fact 1,078M, forecast 1,250M.
- New housing starts (m/m) (December), fact -11.2%, forecast -0.5%.
The construction report in the United States for December at first glance turned out to be quite ambiguous, due to the rapid growth of building permits and a decrease in the volume of construction. If you look at the report more detailed, the actual volume of construction of new homes in the US is noticeably lower than building permits. Despite ever-increasing permits, the actual number of homes continues to decline. Thus, the volume of construction of new homes in the United States in December fell to the values of 2016, thereby indicating the possibility of a bubble in the real estate market in the United States.
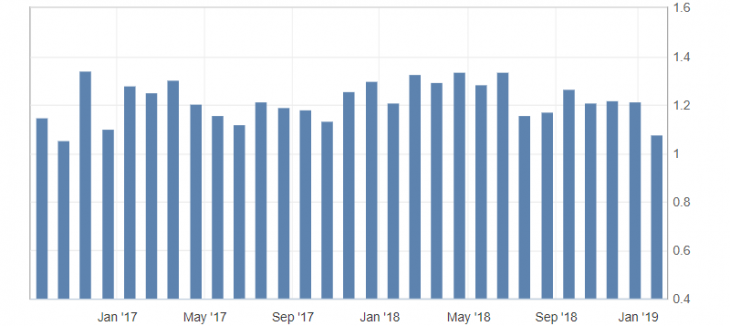
Fig. 1. U.S. new housing starts chart
As a result, the US dollar index continues to trade lower, but limited to the market while waiting for the speech of the US Federal Reserve Chairman Powell. This presentation is expected to give hints at a rate increase in the United States this year. But if Mr. Powell will be soft in his rhetoric, weak data on the US real estate will increase the pressure on the American dollar.
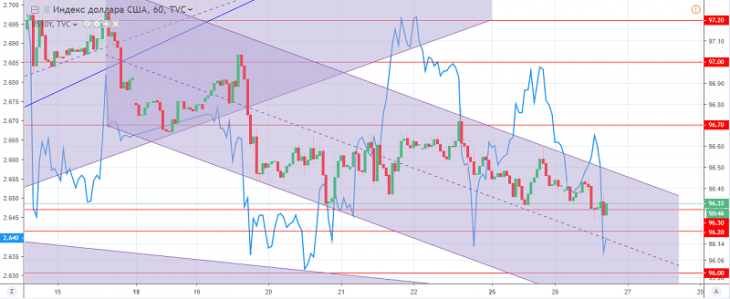
Fig. 2. The US dollar index. The current price is 96.30 (10-year government bonds yield is the blue line)
Read also: “It is easy to get rich, but try to stay rich.”
Hanzenko Anton
Earn with the help of the trade service on the news Erste News!
Topical articles of the trader’s blog:
- Ichimoku Kinko Hyo – simple application of a difficult indicator
- ZIGZAG – not simple properties of a simple indicator!
- Gold. Expectations March 2019!
Current Investment ideas: