US data and Canada’s GDP
- Core price index of personal consumption expenditure (y / y) (July), US, fact 2.0%, forecast 2.0%.
- Core price index of personal consumption expenditure (m / m) (July), US, 0.2%, forecast 0.2%.
- Number of initial jobless claims in US, fact 213K, forecast 214K.
- Personal spending (m / m) (July), US, fact 0.4%, forecast 0.4%.
- GDP (m / m) (June) of Canada, fact 0.0%, forecast 0.1%.
- GDP (y / y) of Canada, fact 2.4%.
- GDP (QoQ) (Q2) of Canada, fact 0.7%.
- GDP annualized (Q2/Q2) of Canada, fact 2.9%, forecast 3.0%.
The Canadian dollar was under pressure on the unexpected slowdown in Canada’s GDP growth, which caused pressure on the Canadian dollar.
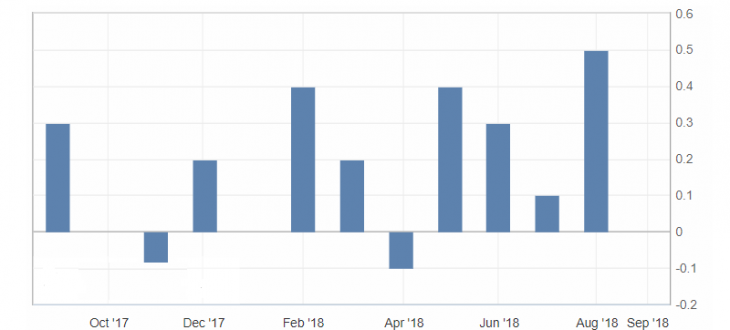
Fig. 1. Canada’s GDP chart
Against the background of a decline in the Canadian dollar, the US dollar received support. Also, the support of the US dollar was the reduction of initial applications for unemployment. As a result, the pair USD/CAD moved to growth on the formation of the “double bottom” figure, which opens the way to resistance levels of 1.3000 and 1.3030.
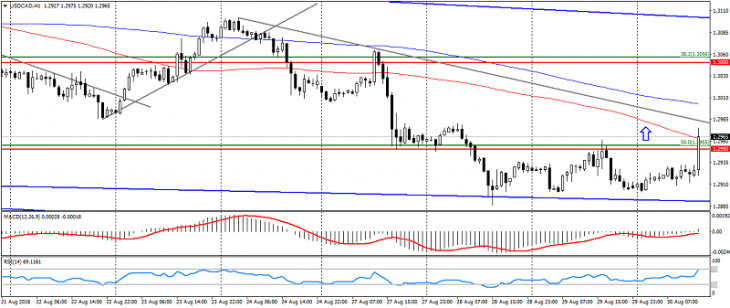
Fig. 2. USD/CAD chart. The current price is 1.2960.
Read also: “Market analysis: undervalued and overvalued shares”
Hanzenko Anton
Earn with the help of the trade service on the news Erste News!
Topical articles of the trader’s blog:
- Norwegian Krone. Features of trading Scandinavian currencies
- Stock indices of America: Canada, Mexico and Brazil
- Trade balance influence on the country’s economy
Current Investment ideas: