
US producer prices
- Core producer price index (PPI) (m / m) (Aug), fact -0.1%, forecast 0.2%.
- Producer price index (PPI) (m / m) (Aug), fact -0.1%, forecast 0.2%.
Weak data on US producer prices increased pressure on the US currency, especially after this figure fell below zero for the first time in half a year.
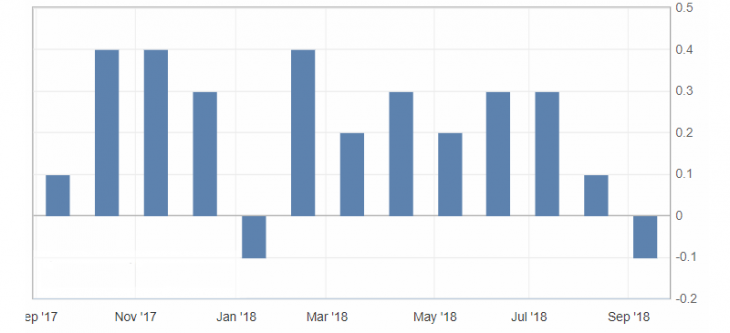
Fig. 1. Producer price chart in the USA
On the other hand, the decline was not more than the annual minimum, which, despite the negative indicators, will have a restrained influence on the market.
The US dollar index reacted very actively to the US data, which is caused by the lack of news and low activity in the market. At the same time, significant support at the level of 95.00-10 remains in force.
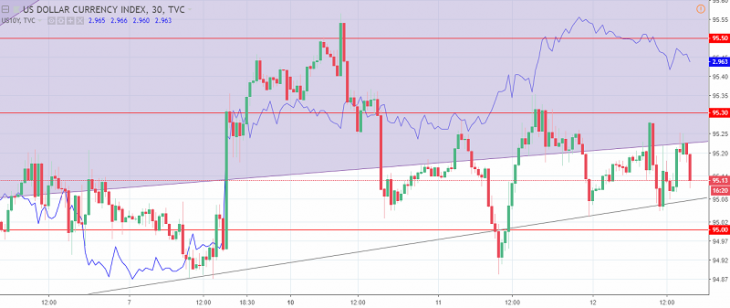
Fig. 2. The US dollar index chart. The current price is 95.10 (10-year government bonds yield is a blue line)
Hanzenko Anton
Earn with the help of the trade service on the news Erste News!
Topical articles of the trader’s blog:
- Singapore dollar. Features of trade.
- How long will last the US trade war against all?!
- Swedish Krona. Features of trading Scandinavian currencies
Current Investment ideas: