Technical Analysis of Oil (Alexander Sivtsov)
Oil shows negative dynamics during the Asian session.
The Brent brand graph (current price: $ 6338.50 per 100 barrels)

The Brent brand is trading below the zero mark during the Asian session.
Technical analysis of cross-rates. (Anton Hanzenko)
EUR GBP (current price: 0.8810)
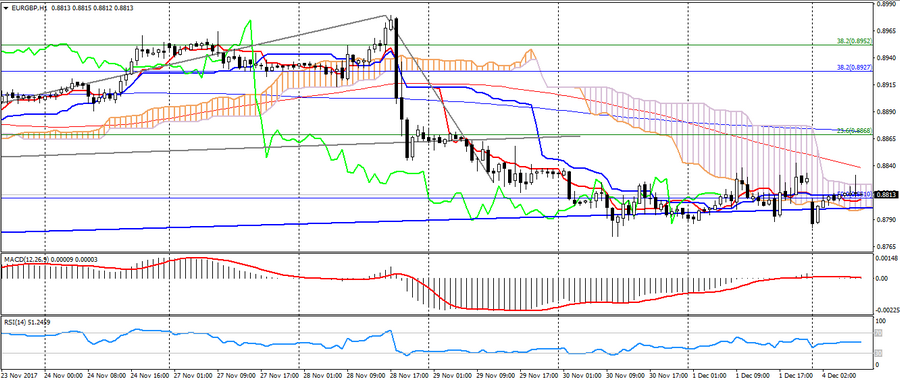
- Support levels: 0.8730 (minimum of the last months), 0.8650, 0.8530.
- Resistance levels: 0.9020, 0.9170, 0.9300 (the maximum of the current year).
- Computer analysis: MACD (12, 26, 9) (signal-flat): the indicator is near 0. RSI (14) is in the neutral zone. Ichimoku Kinko Hyo (9, 26, 52) (flat signal): the Tenkan-sen line is below the Kijun-sen line, the price is in the cloud.
Тechnical analysis of currency pairs (Anton Hanzenko)
EUR USD (current price: 1.1830)

- Support levels: 1.1700 (August 2015 maximum), 1.1600 (2016 maximum), 1.1470.
- Resistance levels: 1.2000, 1.2100, 1.2270 (November 2014 minimum).
- Computer analysis: MACD (12, 26, 9) (signal – downward movement): the indicator is below 0, the signal line is in the body of the histogram. RSI (14) is in the slight oversold zone. Ichimoku Kinko Hyo (9, 26, 52) (signal – downward movement): the Tenkan-sen line is below the Kijun-sen line, the price is below the cloud.
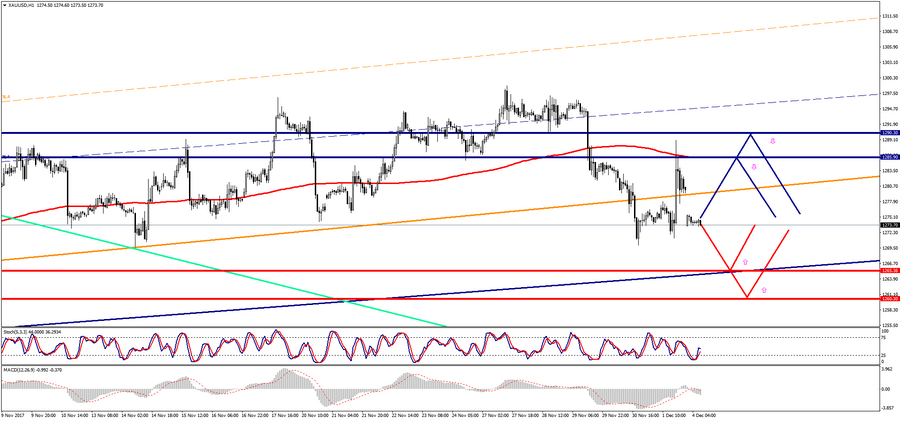
Technical analysis of gold and silver (Alexander Sivtsov)
Gold chart (current price: $ 1275.00)
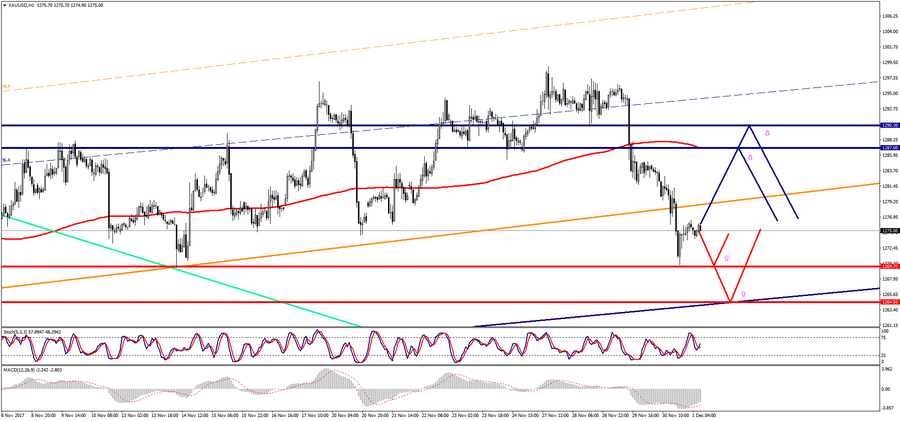
Gold is trading with a small plus during the Asian session.
Тechnical analysis of currency pairs (Anton Hanzenko)
EUR USD (current price: 1.1920)

- Support levels: 1.1700 (August 2015 maximum), 1.1600 (2016 maximum), 1.1470.
- Levels of resistance: 1.2000, 1.2100, 1.2270 (November 2014 minimum).
- Computer analysis: MACD (12, 26, 9) (signal – upward movement): the indicator is above 0, the signal line is in the body of the histogram. RSI (14) is in the neutral zone. Ichimoku Kinko Hyo (9, 26, 52) (signal – upward movement): the Tenkan-sen line is above the Kijun-sen line, the price is higher than the cloud.
Technical analysis of cross-rates. (Anton Hanzenko)
EUR GBP (current price: 0.8810)
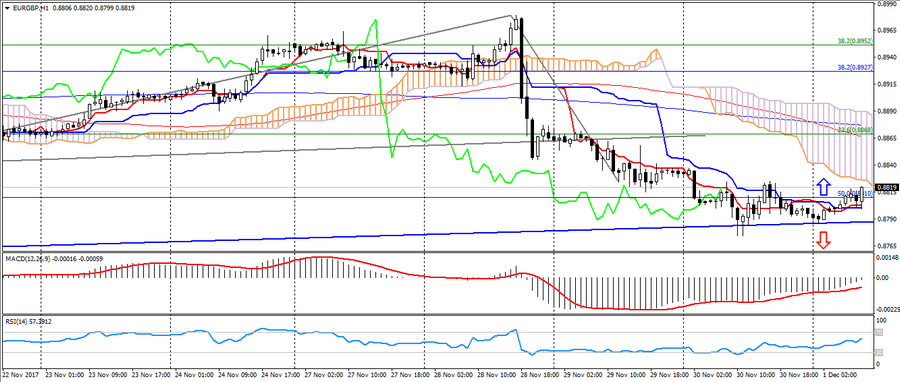
- Support levels: 0.8730 (minimum of the last months), 0.8650, 0.8530.
- Resistance levels: 0.9020, 0.9170, 0.9300 (the maximum of the current year).
- Computer analysis: MACD (12, 26, 9) (signal – upward movement): the indicator is below 0, the signal line has left the body of the histogram. RSI (14) is in the neutral zone. Ichimoku Kinko Hyo (9, 26, 52) (flat signal): the Tenkan-sen line is above the Kijun-sen line, the price is below the cloud.
Technical Analysis of Oil (Alexander Sivtsov)
Oil shows a positive trend during the Asian session.
The Brent graph (current price: $ 6283.80 per 100 barrels)
The Brent brand is trading above the zero mark during the Asian session.
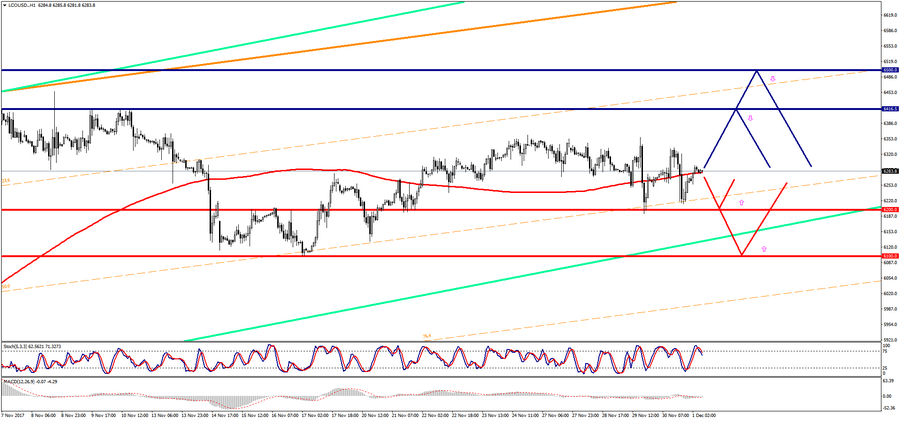
Technical Analysis of Oil (Alexander Sivtsov)
Oil shows a positive trend during the Asian session.
The Brent graph (current price: $ 6279.80 per 100 barrels)

The Brent brand is trading above the zero mark during the Asian session.