Technical analysis of gold and silver (Alexander Sivtsov)
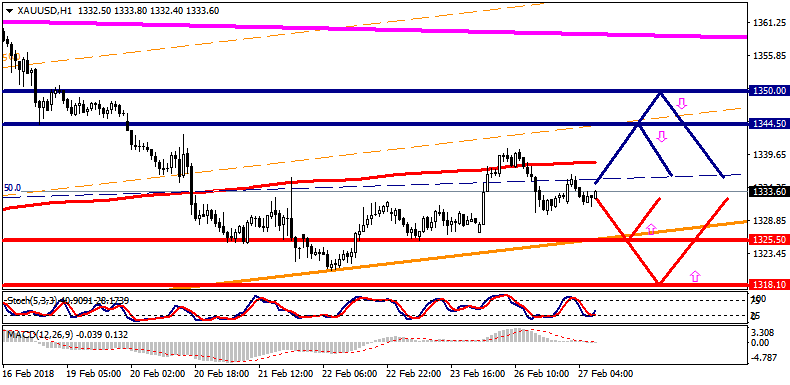
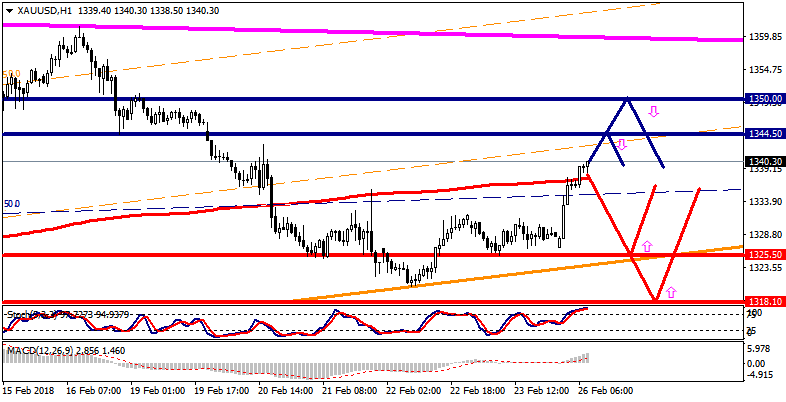
Gold chart (current price: $ 1318.70)
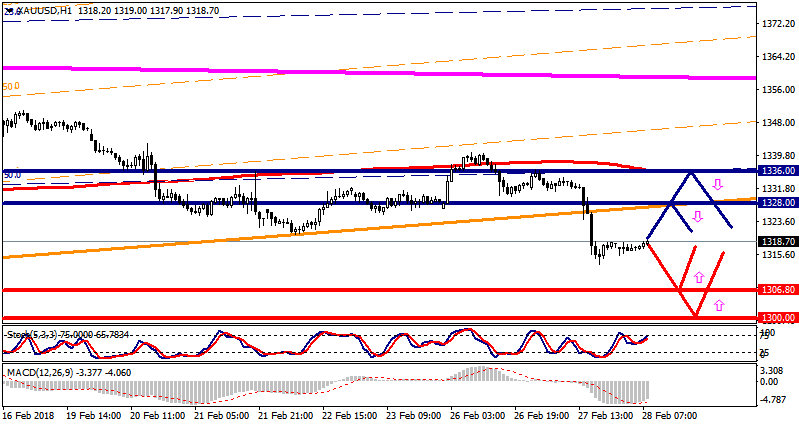
Gold is traded near the zero mark during the Asian session.
Gold is traded near the zero mark during the Asian session.
Oil is traded near zero marks during the Asian session.
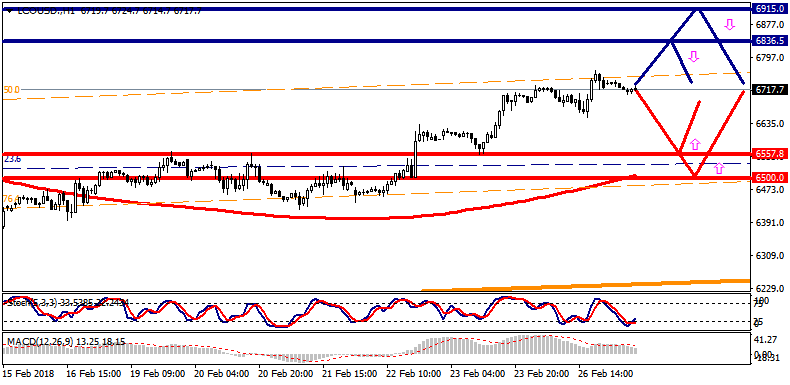
The Brent brand is traded with a small minus during the Asian session.
Gold is traded above the zero mark during the Asian session.
Computer analysis: The Stochastic Oscillator movings on the chart of H4 are in the neutral zone, so the formation of consolidation of the price of gold is possible.
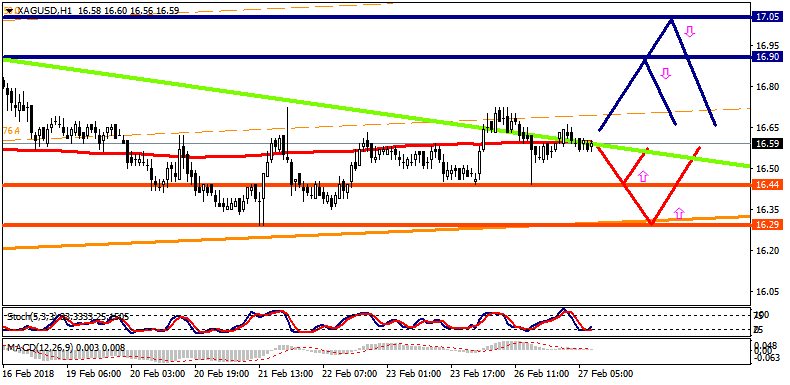
Silver is traded with a plus during the Asian session.
Computer analysis: The Stochastic Oscillator movings on the chart H4 are in the neutral zone, so the movement of silver prices in a narrow range is possible.
Oil is traded above the zero mark in the Asian session.
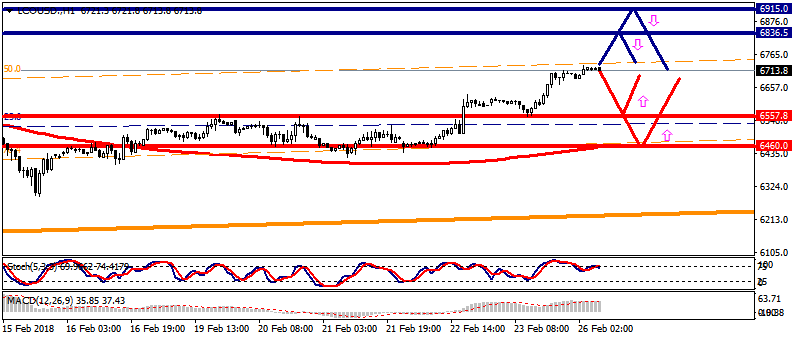
The Brent is traded with a small plus during the Asian session.
Gold is traded above the zero mark during the Asian session.