技术分析

Technical analysis of cross-rates. (Anton Hanzenko)

EUR GBP (current price: 0.8810)

  • Support levels: 0.8730 (minimum of the last months), 0.8650, 0.8530.
  • Resistance levels: 0.8810, 0.8900, 0.9050 (November 2016 maximum).
  • Computer analysis: MACD (12, 26, 9) (signal-upward movement): the indicator is below 0, the signal line has left the body of the histogram. RSI (14) in the neutral zone. IchimokuKinkoHyo (9,26,52) (signal – downward movement): the Tenkan-sen line is below the Kijun-sen line, the price is below the cloud.

Technical Analysis of Oil (Alexander Sivtsov)

Oil is trading below the zero mark in the Asian session.

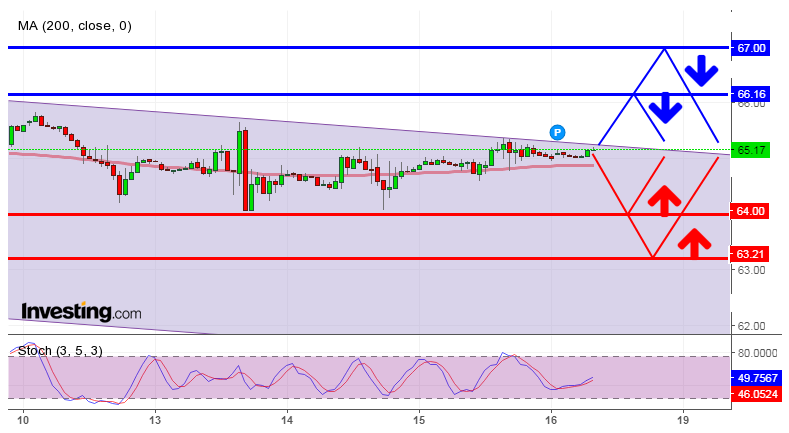
Brent brand Graph (current price: $ 65.17)

Brand Brent is trading below the zero mark during the Asian session.

  • Resistance 1: From $ 67.00 (psychological level)
  • Resistance 2: From $ 67.87 (February 28 maximum)
  • Support 1: From $ 64.89 (March 16 minimum)
  • Support 2: From $ 64.00 (psychological level)

Computer analysis: The movings of the Stochastic Oscillator forex indicator on the H1 chart are in the neutral zone, against which the continuation of the Brent price movement in a narrow range is possible.

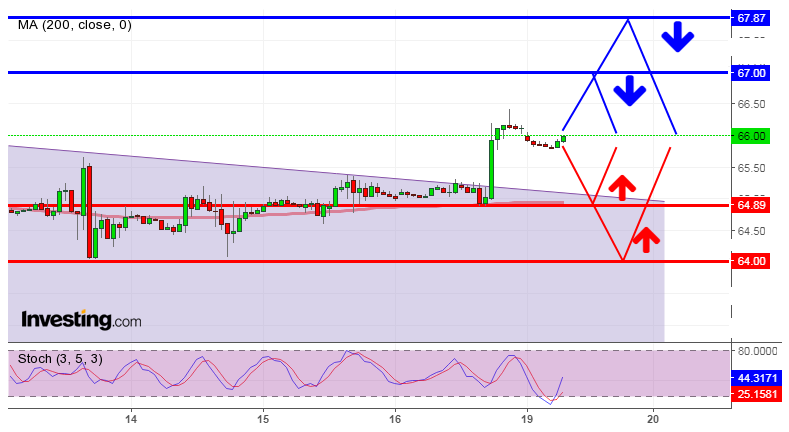
WTI brand Graph (current price: $ 61.27)

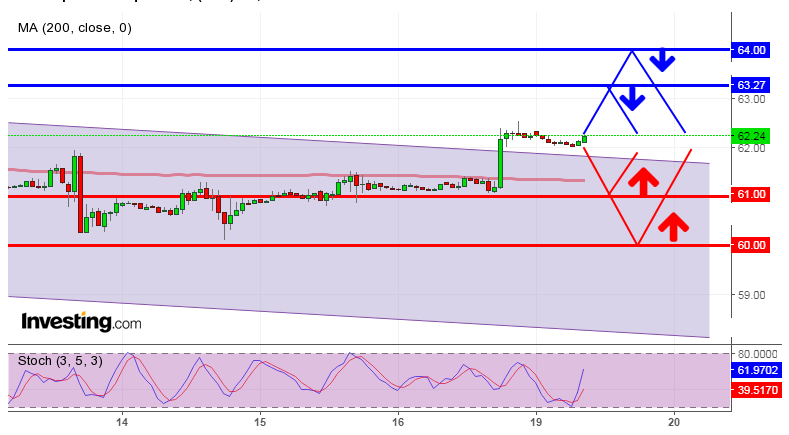
The WTI brand trades with a small minus during the Asian session.

  • Resistance 1: From $ 63.27 (March 6 maximum)
  • Resistance 2: From $ 64.00 (psychological level)
  • Support 1: From $ 61.00 (psychological level)
  • Support 2: From $ 60.00 (psychological level)

Computer analysis: The movings of the Stochastic Oscillator forex indicator on the H1 chart are in the neutral zone, in connection with it one should expect the continuation of the WTI price consolidation.

Тechnical analysis of currency pairs (Anton Hanzenko)

EUR USD (current price: 1.2260)

  • Support levels: 1.2100 (September 2017 maximum), 1.1900, 1.1700.
  • Resistance levels: 1.2600, 1.2750 (March 2013 minimum), 1.2270 (November 2014 minimum).
  • Computer analysis: MACD (12,26,9) (signal-downward movement): the indicator is below 0, the signal line in the body of the histogram. RSI (14) in the oversold zone. IchimokuKinkoHyo (9,26,52) (signal-downward movement): the Tenkan-sen line below the Kijun-sen line, the price is below the cloud.

Тechnical analysis of currency pairs (Anton Hanzenko)

EUR USD (current price: 1.2320)

  • Support levels: 1.2100 (September 2017 maximum), 1.1900, 1.1700.
  • Resistance levels: 1.2600, 1.2750 (March 2013 minimum), 1.2270 (November 2014 minimum).
  • Computer analysis: MACD (12,26,9) (signal – upward movement): the indicator is below 0, the signal line has left the body of the histogram. RSI (14) in the neutral zone. IchimokuKinkoHyo (9,26,52) (signal – downward movement): the Tenkan-sen line is below the Kijun-sen line, the price is below the cloud.

Technical analysis of cross-rates. (Anton Hanzenko)

EUR GBP (current price: 0.8820)

  • Support levels: 0.8730 (minimum of the last months), 0.8650, 0.8530.
  • Resistance levels: 0.8810, 0.8900, 0.9050 (November 2016 high).
  • Computer analysis: MACD (12, 26, 9) (signal – upward movement): the indicator is below 0, the signal line has left the body of the histogram. RSI (14) in the neutral zone. IchimokuKinkoHyo (9,26,52) (signal – downward movement): the Tenkan-sen line is below the Kijun-sen line, the price is below the cloud.