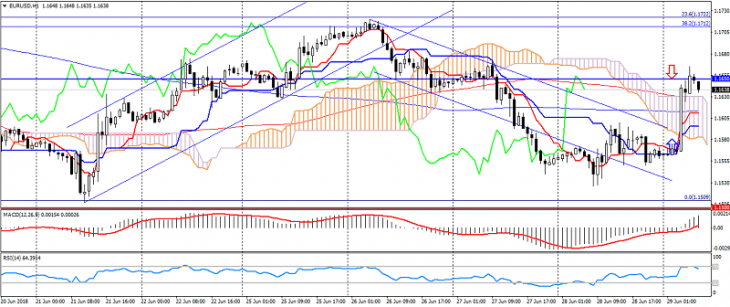
EUR USD (current price: 1.1540)
- Support levels: 1.1500 (local minimum), 1.1450, 1.1380.
- Resistance levels: 1.1650, 1.1750, 1.1850 (June maximum).
- Computer analysis: MACD (12, 26, 9) (signal – upward movement): the indicator is below 0, the signal line has left the body of the histogram. RSI (14) in the zone of easy overselling. Ichimoku Kinko Hyo (9, 26, 52) (signal – downward movement): the Tenkan-sen line is below the Kijun-sen line, the price is below the cloud.
- The main recommendation: entrance for sale from 1.1580, 1.1600, 1.1630.
- Alternative recommendation: entry to buy from 1.1520, 1.1500, 1.1480.
The euro-dollar pair accelerated the decline on the overall growth of the American dollar, limited to oversold.
GBP USD (current price: 1.3070)
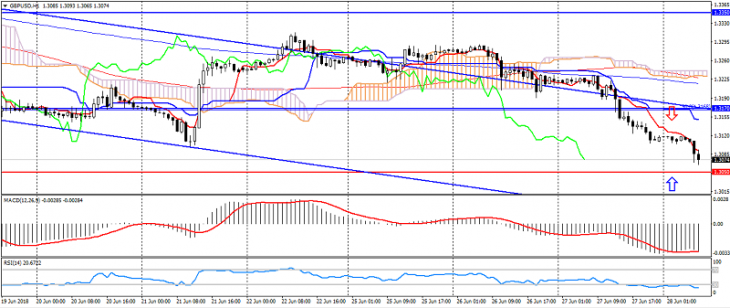
- Support levels: 1.3050, 1.3000 (strong psychology), 1.2900.
- Resistance levels: 1.3170, 1.3350 (June maximum), 1.3460.
- Computer analysis: MACD (12, 26, 9) (signal – downward movement): the indicator is below 0, the signal line in the body of the histogram. RSI (14) in the oversold zone. Ichimoku Kinko Hyo (9, 26, 52) (signal – downward movement): the Tenkan-sen line is below the Kijun-sen line, the price is below the cloud.
- The main recommendation: sale entry is from 1.3120, 1.3170, 1.3230.
- Alternative recommendation: buy entry is from 1.3050, 1.3020, 1.3000.
The British pound remains under pressure to return to a downtrend.
USD CHF (current price: 0.9980)
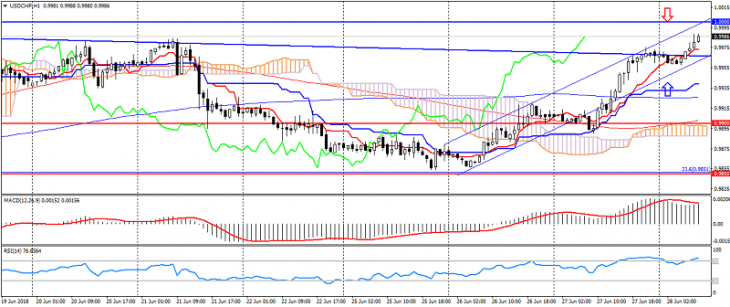
- Support levels: 0.9900, 0.9850 (local minimum), 0.9700 (the minimum of June).
- Resistance levels: 1.000 (significant psychology), 1.0050 (May maximum), 1.0150.
- Computer analysis: MACD (12, 26, 9) (signal – upward movement): indicator above 0, signal line in the body of the histogram. RSI (14) in the overbought zone. Ichimoku Kinko Hyo (9, 26, 52) (signal – upward movement): the Tenkan-sen line above the Kijun-sen line, the price is higher than the cloud.
- The main recommendation: sale entry is from 1.0000, 1.0020, 1.0050.
- Alternative recommendation: buy entry is from 0.9960, 0.9930, 0.9900.
The Swiss franc also strengthened on the dollar’s growth, but is limited by a general downward trend.
USD JPY (current price: 110.40)
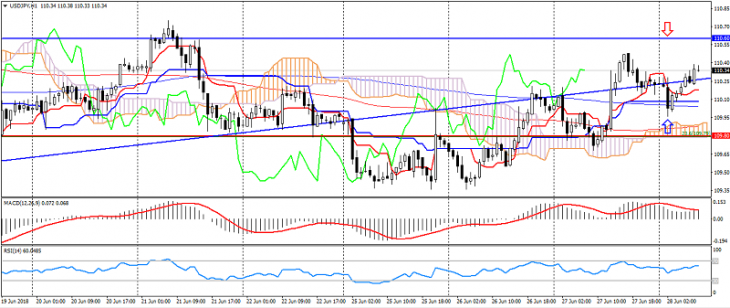
- Support levels: 109.80, 109.00 (the minimum of May), 108.00.
- Resistance levels: 110.60, 110.40 (May maximum), 112.00.
- Computer analysis: MACD (12, 26, 9) (signal – upward movement): indicator above 0, signal line in the body of the histogram. RSI (14) in the neutral zone. Ichimoku Kinko Hyo (9, 26, 52) (signal – upward movement): the Tenkan-sen line above the Kijun-sen line, the price is higher than the cloud.
- The main recommendation: sale entry is from 110.60, 110.80 111.50.
- Alternative recommendation: buy entry is from 110.10, 109.80, 109.50.
The US dollar the Japanese yen remains positive, despite rising risks.
USD CAD (current price: 1.3350)
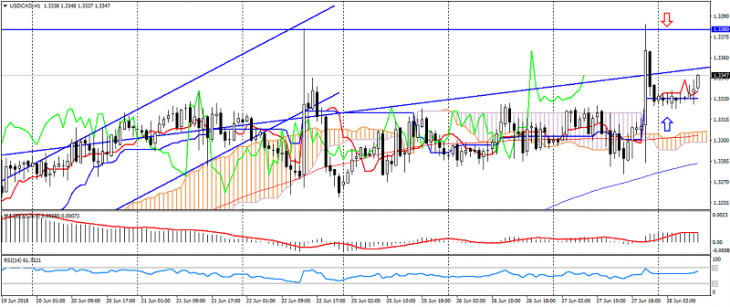
- Support levels: 1.3250, 1.3150, 1.3050 (May high).
- Resistance levels: 1.3380, 1.3450 (June maximum), 1.3540.
- Computer analysis: MACD (12, 26, 9) (signal – upward movement): indicator above 0, signal line in the body of the histogram. RSI (14) in the neutral zone. Ichimoku Kinko Hyo (9, 26, 52) (signal – upward movement): the Tenkan-sen line above the Kijun-sen line, the price is higher than the cloud.
- The main recommendation: sale entry is from 1.3360, 1.3380, 1.3400.
- Alternative recommendation: buy entry is from 1.3330, 1.3300, 1.3280.
A pair of US dollars the Canadian dollar moves near the upper boundary of the rising channel on the strengthening of the American dollar.
AUD USD (current price: 0.7330)
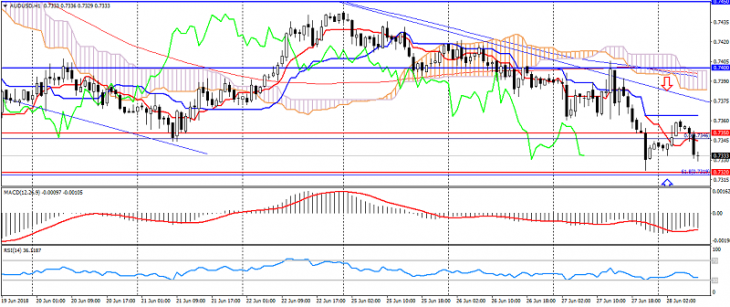
- Support levels: 0.7350, 0.7320, 0.7250.
- Resistance levels: 0.7400, 0.7450, 0.7500.
- Computer analysis: MACD (12, 26, 9) (signal – downward movement): the indicator is below 0, the signal line in the body of the histogram. RSI (14) in the neutral zone. Ichimoku Kinko Hyo (9, 26, 52) (signal – downward movement): the Tenkan-sen line is below the Kijun-sen line, the price is below the cloud.
- The main recommendation: sale entry is from 0.7360, 0.7380, 0.7400.
- Alternative recommendation: buy entry is from 0.7320, 0.7300, 0.7280.
The Australian dollar remains under pressure on the growth of the American dollar.
NZD USD (current price: 0.6760)
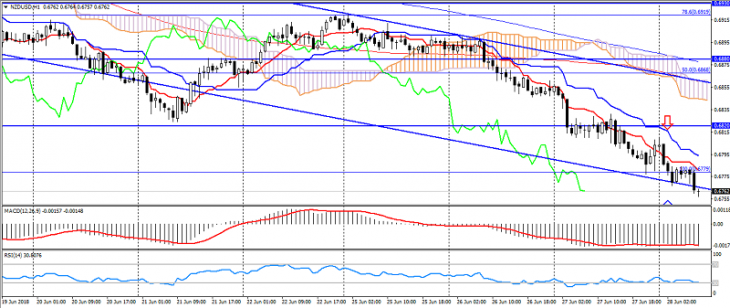
- Support levels: 0.6750, 0.6700 (significant psychology), 0.6650.
- Resistance levels: 0.6820, 0.6880, 0.6930.
- Computer analysis: MACD (12, 26, 9) (signal – downward movement): the indicator is below 0, the signal line in the body of the histogram. RSI (14) in the oversold zone. Ichimoku Kinko Hyo (9, 26, 52) (signal – downward movement): the Tenkan-sen line below the Kijun-sen line, the price is in the cloud.
- The main recommendation: sale entry is from 0.6800, 0.6840, 0.6880.
- Alternative recommendation: buy entry is from 0.6750, 0.6700, 0.6680.
The New Zealand dollar also traded with a decrease in the growth of risks in the region.
XAU USD (current price: 1249.00)
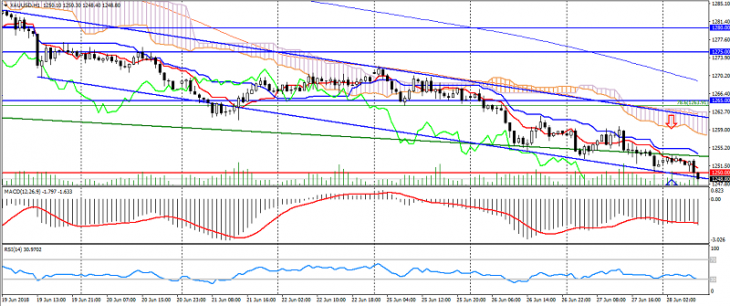
- Support levels: 1250.00, 1242.00, 1235.00.
- Resistance levels: 1265.00, 1275.00, 1290.00.
- Computer analysis: MACD (12, 26, 9) (signal – downward movement): the indicator is below 0, the signal line in the body of the histogram. RSI (14) in the oversold zone. Ichimoku Kinko Hyo (9, 26, 52) (signal – downward movement): the Tenkan-sen line is below the Kijun-sen line, the price is below the cloud.
- The main recommendation: sale entry is from 1255.00, 1259.00, 1262.00.
- Alternative recommendation: buy entry is from 1242.00, 1240.00, 1236.00.
Gold remains under pressure, limited to oversold and bullish divergence.
Forex indicators used in Technical analysis: MACD, RSI, Ichimoku Kinko Hyo, Equal-channel, Fibonacci lines, Price Levels.