技术分析

Тechnical analysis of currency pairs (Anton Hanzenko)

Forex indicators used in Technical analysis: MACD, RSI, Ichimoku Kinko Hyo, Equal-channel, Fibonacci lines, Price Levels.

Earn with the help of the trade service on the news Erste News!


EUR USD (current price: 1.1730)
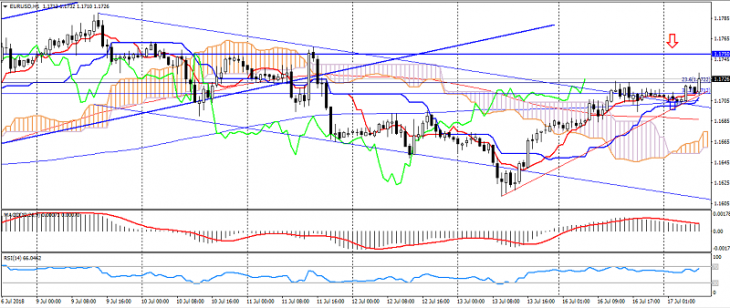
  • Support levels: 1.1600 (significant psychology), 1.1500 (local minimum), 1.1450.
  • Resistance levels: 1.1750, 1.1850 (June maximum), 1.2000 (May maximum).
  • Computer analysis: MACD (12, 26, 9) (signal – upward movement): indicator above 0, signal line in the body of the histogram. RSI (14) in the overbought zone. Ichimoku Kinko Hyo (9, 26, 52) (signal – upward movement): the Tenkan-sen line above the Kijun-sen line, the price is higher than the cloud.
Technical analysis of gold and silver (Andre Green)

Forex indicators used in Technical analysis: MACD, RSI, Ichimoku Kinko Hyo, Equal-channel, Fibonacci lines, Price Levels.

Earn with the help of the trade service on the news Erste News!


Gold Chart (current price: $ 1241.00)


Gold is traded with a slight strengthening on the weakness of the American dollar, thereby adjusting after updating the next low.

Technical analysis of oil (Dani Leviant)

Forex indicators used in Technical analysis: MACD, RSI, Ichimoku Kinko Hyo, Equal-channel, Fibonacci lines, Price Levels.

Earn with the help of the trade service on the news Erste News!


Oil is trading slightly below the opening of the day at the beginning of the week, due to the resumption of oil supplies from Libya and weak data on China. Also, the oil market is very reserved before the meeting of the leaders of the US and Russia and the expectation of an increase in oil production in Russia.

Brent brand chart (current price: $ 74.90)


Brand Brent is trading slightly below the opening of the day, limited to the trading range of Friday.

Technical analysis of cross-rates. (Anton Hanzenko)

Forex indicators used in Technical analysis: MACD, RSI, Ichimoku Kinko Hyo, Equal-channel, Fibonacci lines, Price Levels.

Earn with the help of the trade service on the news Erste News!


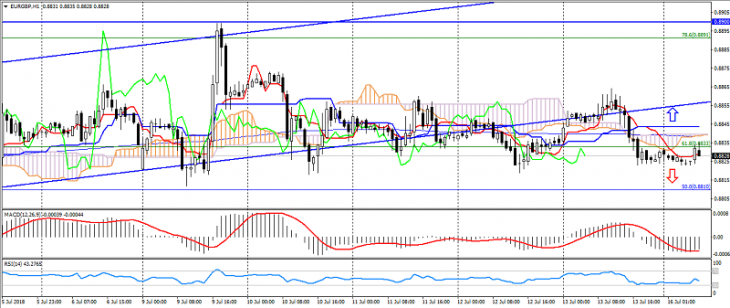
EUR GBP (current price: 0.8830)

  • Support levels: 0.8790, 0.8730 (minimum of the last months), 0.8700 (strong psychology).
  • Resistance levels: 0.8900, 0.8960 (March maximum), 0.9000 (strong psychology).
  • Computer analysis: MACD (12, 26, 9) (signal – upward movement): the indicator is below 0, the signal line in the body of the histogram. RSI (14) in the neutral zone. Ichimoku Kinko Hyo (9, 26, 52) (signal – downward movement): the Tenkan-sen line is below the Kijun-sen line, the price is below the cloud.

Тechnical analysis of currency pairs (Anton Hanzenko)

Forex indicators used in Technical analysis: MACD, RSI, Ichimoku Kinko Hyo, Equal-channel, Fibonacci lines, Price Levels.

Earn with the help of the trade service on the news Erste News!


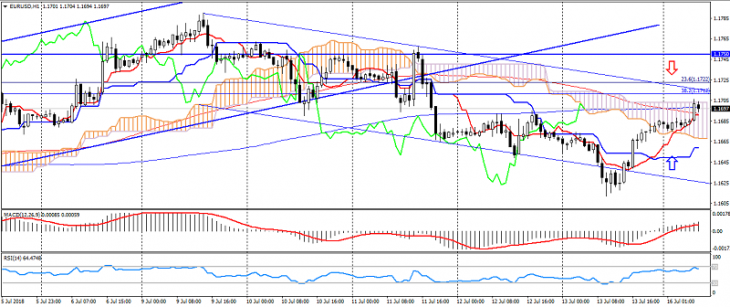
EUR USD (current price: 1.1700)

  • Support levels: 1.1600 (significant psychology), 1.1500 (local minimum), 1.1450.
  • Resistance levels: 1.1750, 1.1850 (June maximum), 1.2000 (May maximum).
  • Computer analysis: MACD (12, 26, 9) (signal – upward movement): indicator above 0, signal line in the body of the histogram. RSI (14) in the overbought zone. Ichimoku Kinko Hyo (9, 26, 52) (flat signal): the Tenkan-sen line above the Kijun-sen line, the price is in the clouds.

Technical analysis of gold and silver (Andre Green)

Forex indicators used in Technical analysis: MACD, RSI, Ichimoku Kinko Hyo, Equal-channel, Fibonacci lines, Price Levels.

Earn with the help of the trade service on the news Erste News!


Gold Chart (current price: $ 1241.00)


Gold remains under pressure from a growing US dollar, thereby confirming the safety of the downtrend.

Technical analysis of oil (Dani Leviant)

Forex indicators used in Technical analysis: MACD, RSI, Ichimoku Kinko Hyo, Equal-channel, Fibonacci lines, Price Levels.

Earn with the help of the trade service on the news Erste News!


Oil quotes on Friday show a moderate decline, despite the absence of obvious negative factors and the positive dynamics of stock indices. Reduction of oil in this case can be associated with a technical correction before the weekend and possible risks that remain on the market.

Brent brand chart (current price: $ 73.60)


The Brent brand traded in a lateral trend after a decline on Wednesday, thereby maintaining the potential for weakening.

Technical analysis of cross-rates. (Anton Hanzenko)

Forex indicators used in Technical analysis: MACD, RSI, Ichimoku Kinko Hyo, Equal-channel, Fibonacci lines, Price Levels.

Earn with the help of the trade service on the news Erste News!


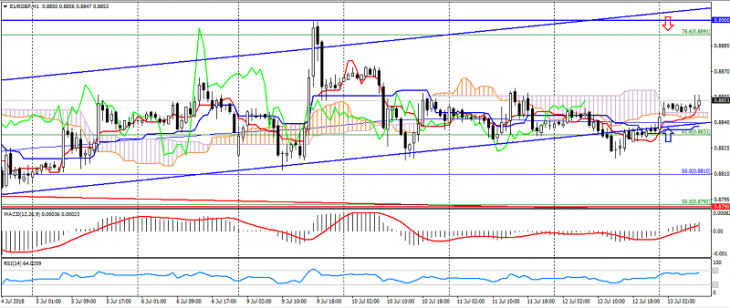
EUR GBP (current price: 0.8850)

  • Support levels: 0.8790, 0.8730 (minimum of the last months), 0.8700 (strong psychology).
  • Resistance levels: 0.8900, 0.8960 (March maximum), 0.9000 (strong psychology).
  • Computer analysis: MACD (12, 26, 9) (signal – upward movement): indicator above 0, signal line in the body of the histogram. RSI (14) in the neutral zone. Ichimoku Kinko Hyo (9, 26, 52) (signal – upward movement): the Tenkan-sen line above the Kijun-sen line, the price is higher than the cloud.
Тechnical analysis of currency pairs (Anton Hanzenko)

Forex indicators used in Technical analysis: MACD, RSI, Ichimoku Kinko Hyo, Equal-channel, Fibonacci lines, Price Levels.

Earn with the help of the trade service on the news Erste News!


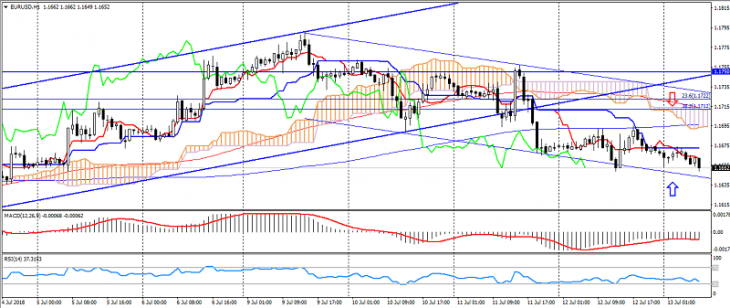
EUR USD (current price: 1.1650)

  • Support levels: 1.1600 (significant psychology), 1.1500 (local minimum), 1.1450.
  • Resistance levels: 1.1750, 1.1850 (June maximum), 1.2000 (May maximum).
  • Computer analysis: MACD (12, 26, 9) (signal – downward movement): the indicator is below 0, the signal line in the body of the histogram. RSI (14) in the zone of easy overselling. Ichimoku Kinko Hyo (9, 26, 52) (signal – downward movement): the Tenkan-sen line is below the Kijun-sen line, the price is below the cloud.