技术分析

Technical analysis of oil (Dani Leviant)

Forex indicators used in Technical analysis: MACD, RSI, Ichimoku Kinko Hyo, Equal-channel, Fibonacci lines, Price Levels.

Earn with the help of the trade service on the news Erste News!


Oil is traded with strengthening on the waiting for sanctions against Iran.

Brent brand chart (current price: $ 78.10)


Brand Brent resumed growth at the start of the day from optimism and increased demand for oil due to the expectation of the November sanctions against Iran.

Technical analysis of cross-rates. (Anton Hanzenko)

Forex indicators used in Technical analysis: MACD, RSI, Ichimoku Kinko Hyo, Equal-channel, Fibonacci lines, Price Levels.

Earn with the help of the trade service on the news Erste News!


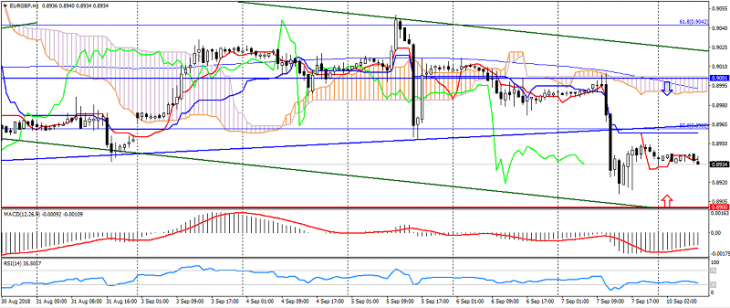
EUR GBP (current price: 0.8890)

  • Support levels: 0.8900, 0.8850, 0.8800.
  • Resistance levels: 0.9000 (strong psychology), 0.9070, 0.9150.
  • Computer analysis: MACD (12, 26, 9) (signal – upward movement): the indicator is below 0, the signal line is pierced from the body of the histogram. RSI (14) in the oversold zone. Ichimoku Kinko Hyo (9, 26, 52) (signal – downward movement): the Tenkan-sen line is below the Kijun-sen line, the price is below the cloud.


  • The main recommendation:  sale entry is from 0.8910, 0.8940, 0.8960.
  • Alternative recommendation: buy entry is from 0.8880, 0.8860, 0.8840.

The euro pound pair is trading lower with an increase in optimism and positive employment data in the UK.

EUR JPY (current price: 129.50)

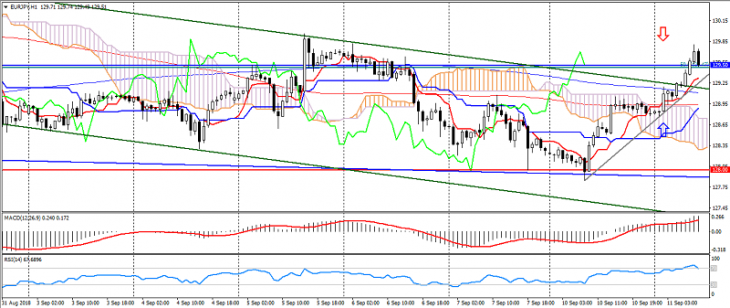
  • Support levels: 128.00, 126.00, 125.00.
  • Resistance levels: 129.50, 130.50, 132.00.
  • Computer analysis: MACD (12, 26, 9) (signal – upward movement): indicator above 0, signal line in the body of the histogram. RSI (14) in the overbought zone. Ichimoku Kinko Hyo (9, 26, 52) (signal – upward movement): the Tenkan-sen line above the Kijun-sen line, the price is higher than the cloud.
  • The main recommendation: sale entry is from 129.80, 130.00, 130.20.
  • Alternative recommendation: buy entry is from 129.20, 128.80, 128.50

The euro yen slowed the downtrend on risk mitigation, but is limited to overbought.

GBP JPY (current price: 145.50)

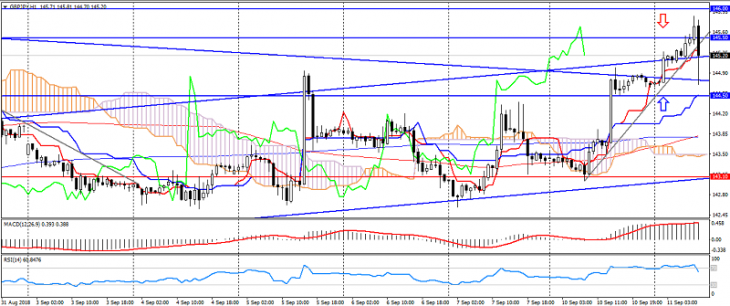
  • Support levels: 141.50, 140.50, 139.20.
  • Resistance levels: 143.00, 144.50, 145.50.
  • Computer analysis: MACD (12, 26, 9) (signal – upward movement): indicator above 0, signal line in the body of the histogram. RSI (14) in the neutral zone. Ichimoku Kinko Hyo (9, 26, 52) (signal – upward movement): the Tenkan-sen line above the Kijun-sen line, the price is higher than the cloud.
  • The main recommendation: sale entry is from 145.50, 146.00, 146.50.
  • Alternative recommendation: buy entry is from 145.00, 144.60, 144.30.

The pound-yen pair is trading with a strengthening on the pound’s rise, supported by positive employment data in the UK.

EUR CHF (current price: 1.1300)

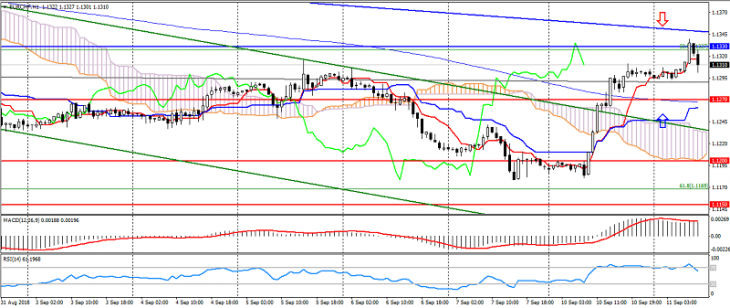
  • Support levels: 1.1270, 1.1200, 1.1150.
  • Resistance levels: 1.1330, 1.1400, 1.1450.
  • Computer analysis: MACD (12, 26, 9) (signal – upward movement): indicator above 0, signal line in the body of the histogram. RSI (14) in the overbought zone. Ichimoku Kinko Hyo (9, 26, 52) (signal – upward movement): the Tenkan-sen line above the Kijun-sen line, the price is higher than the cloud.
  • The main recommendation:  sale entry is from 1.1330, 1.1350, 1.1380.
  • Alternative recommendation: buy entry is from 1.1290, 1.1270, 1.1240.

The euro-franc pair has moved to a decline from 1.1330, but retains the potential for growth.

Тechnical analysis of currency pairs (Anton Hanzenko)

Forex indicators used in Technical analysis: MACD, RSI, Ichimoku Kinko Hyo, Equal-channel, Fibonacci lines, Price Levels.

Earn with the help of the trade service on the news Erste News!


EUR USD (current price: 1.1630)

  • Support levels: 1.1450, 1.1350, 1.1200.
  • Resistance levels: 1.1550, 1.1650, 1.1740.
  • Computer analysis: MACD (12, 26, 9) (signal – upward movement): indicator above 0, signal line in the body of the histogram. RSI (14) in the overbought zone. Ichimoku Kinko Hyo (9, 26, 52) (signal – upward movement): the Tenkan-sen line above the Kijun-sen line, the price is higher than the cloud.

Technical analysis of gold and silver (Andre Green)

Forex indicators used in Technical analysis: MACD, RSI, Ichimoku Kinko Hyo, Equal-channel, Fibonacci lines, Price Levels.

Earn with the help of the trade service on the news Erste News!


Gold chart (current price: $ 1202.00)


Gold is trading lower on  the American dollar  strengthening and maintaining a downtrend.

Technical analysis of oil (Dani Leviant)

Forex indicators used in Technical analysis: MACD, RSI, Ichimoku Kinko Hyo, Equal-channel, Fibonacci lines, Price Levels.

Earn with the help of the trade service on the news Erste News!


Oil quotes show an increase in the reduction of drilling activity, correction after the reduction and the expectation of sanctions against Iran.

Brent brand chart (current price: $ 77.70)


Brand Brent is trading near last week’s highs on renewed optimism not the oil market due to expectations of a reduction in supply due to sanctions against Iran.

Technical analysis of cross-rates. (Anton Hanzenko)

Forex indicators used in Technical analysis: MACD, RSI, Ichimoku Kinko Hyo, Equal-channel, Fibonacci lines, Price Levels.

Earn with the help of the trade service on the news Erste News!


EUR GBP (current price: 0.8940)

  • Support levels: 0.8900, 0.8850, 0.8800.
  • Resistance levels: 0.9000 (strong psychology), 0.9070, 0.9150.
  • Computer analysis: MACD (12, 26, 9) (signal – upward movement): the indicator is below 0, the signal line is pierced from the body of the histogram. RSI (14) in the neutral zone. Ichimoku Kinko Hyo (9, 26, 52) (signal – downward movement): the Tenkan-sen line is below the Kijun-sen line, the price is below the cloud.

Тechnical analysis of currency pairs (Anton Hanzenko)

Forex indicators used in Technical analysis: MACD, RSI, Ichimoku Kinko Hyo, Equal-channel, Fibonacci lines, Price Levels.

Earn with the help of the trade service on the news Erste News!


EUR USD (current price: 1.150)

  • Support levels: 1.1450, 1.1350, 1.1200.
  • Resistance levels: 1.1550, 1.1650, 1.1740.
  • Computer analysis: MACD (12, 26, 9) (signal – downward motion): the indicator is below 0, the signal line is below the body of the histogram. RSI (14) in the oversold zone. Ichimoku Kinko Hyo (9, 26, 52) (signal – downward movement): the Tenkan-sen line is below the Kijun-sen line, the price is below the cloud.

Technical analysis of gold and silver (Andre Green)

Forex indicators used in Technical analysis: MACD, RSI, Ichimoku Kinko Hyo, Equal-channel, Fibonacci lines, Price Levels.

Earn with the help of the trade service on the news Erste News!


Gold chart (current price: $ 1202.00)


Gold is trading with a decline in maintaining risks, but is also limited to a downtrend.

Technical analysis of oil (Dani Leviant)

Forex indicators used in Technical analysis: MACD, RSI, Ichimoku Kinko Hyo, Equal-channel, Fibonacci lines, Price Levels.

Earn with the help of the trade service on the news Erste News!


Oil quotes continue to trade lower after the EIA data on the growth of gasoline inventories in the US.

Brent brand chart (current price: $ 76.40)


Brand Brent is traded near the lower border of the upward channel, limiting itself to oversold.